. 2017 Mar 22;6:e23250. doi: 10.7554/eLife.23250

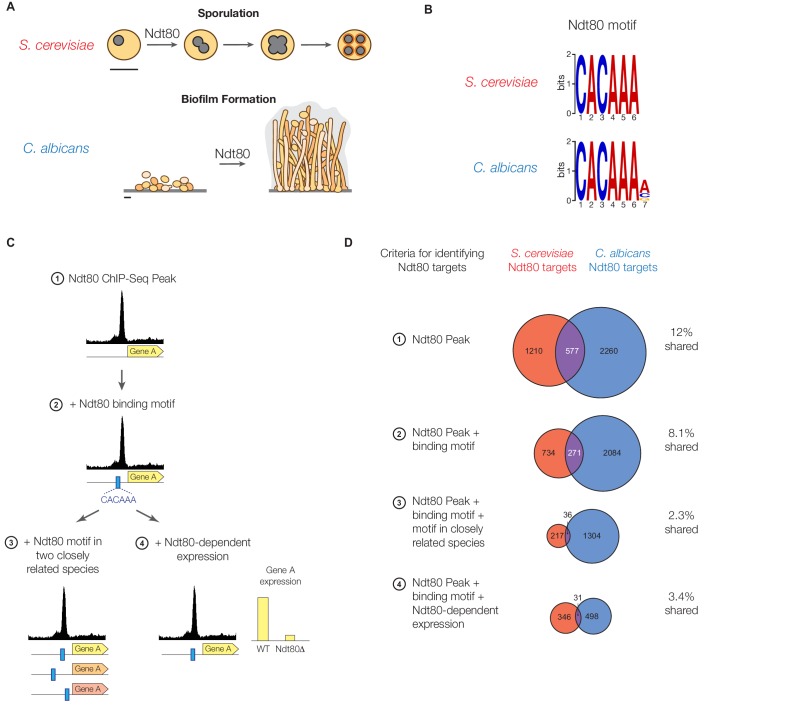
Figure 1. Ndt80 target genes differ between S. cerevisiae and C. albicans.

(A) Diagram of sporulation in S. cerevisiae and biofilm formation in C. albicans. Scale bars represent 5 µm. (B) The cis-regulatory motif most highly enriched at locations of Ndt80 ChIP binding in S. cerevisiae and C. albicans. Motifs were generated independently for each species using DREME. The Ndt80 motifs determined de novo in this study closely match those identified previously for Ndt80 (Chu and Herskowitz, 1998; Jolly et al., 2005; Nobile et al., 2012). (C) Diagram of the four criteria used to identify Ndt80 regulatory targets. Criteria 1: significant ChIP-Seq enrichment in the intergenic region upstream of a gene relative to untagged control experiments. Criteria 2: ChIP-Seq enrichment and the presence of an Ndt80 motif in the intergenic region. Criteria 3: ChIP-Seq enrichment with the Ndt80 motif present in the intergenic region and also in orthologous intergenic regions of two very closely related species, suggesting the motif has been maintained by selection. Criteria 4: ChIP-Seq enrichment with the Ndt80 motif present in the intergenic region and Ndt80-dependent expression of the nearby gene, indicating that expression of the gene is under Ndt80 control. (D) Overlap in targets of S. cerevisiae Ndt80 (red) and C. albicans Ndt80B (blue), using the four different criteria from (C) to identify targets, when Ndt80 is highly expressed in each species (Materials and methods). Venn diagrams are roughly area-proportional (Hulsen et al., 2008).

DOI: http://dx.doi.org/10.7554/eLife.23250.002

Figure 1.

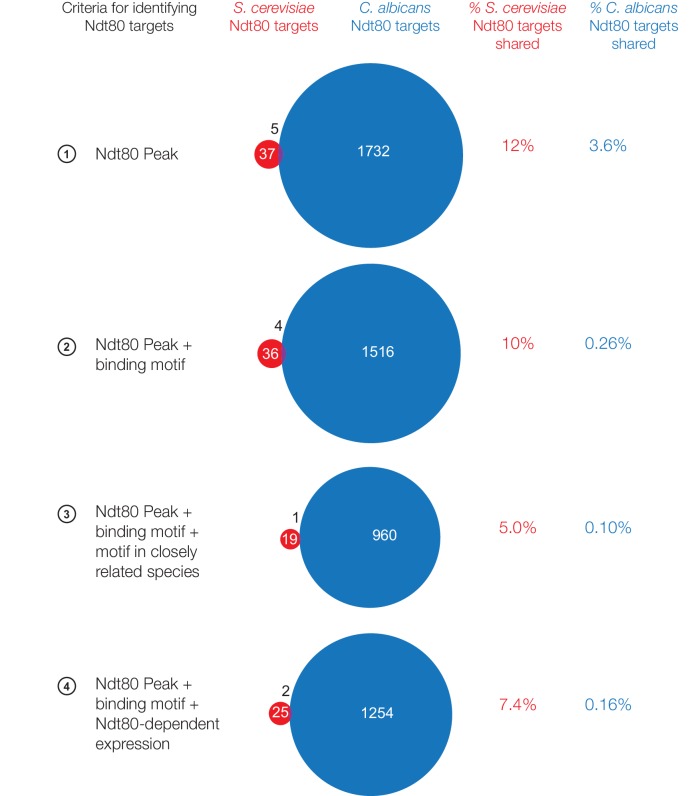
Figure 1—figure supplement 1. Ndt80 targets in S. cerevisiae and C. albicans when Ndt80 is endogenously expressed.

Figure 1—figure supplement 1.

Ndt80 targets identified for S. cerevisiae Ndt80 (red) and C. albicans Ndt80B (blue), using four different criteria to identify targets (Figure 1C). Ndt80 expression in each species is driven by the native promoter (S. cerevisiae ChIP performed during sporulation, C. albicans ChIP performed during mitotic growth). As the sizes of the regulons are dramatically different between the species, the percent of targets shared is shown for each species individually. The black numbers above the Venn diagrams represent the number of overlapping targets.

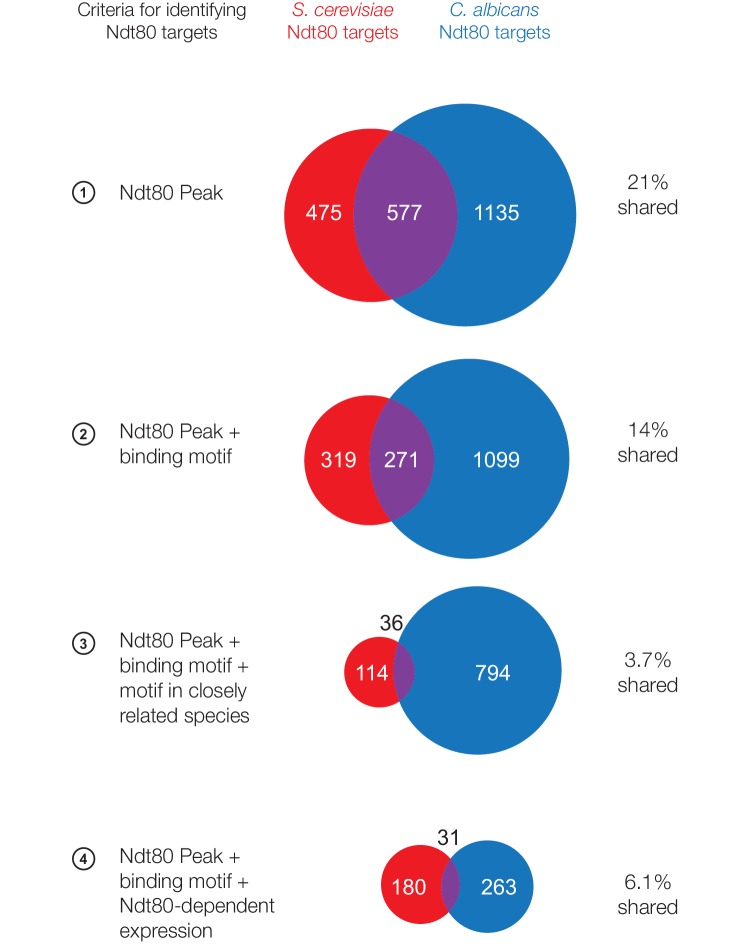
Figure 1—figure supplement 2. Ndt80 targets in S. cerevisiae and C. albicans considering only 1:1 orthologs between species.

Figure 1—figure supplement 2.

Ndt80 targets identified for S. cerevisiae Ndt80 (red) and C. albicans Ndt80B (blue), using four different criteria to identify targets (Figure 1C). Ndt80 expression in each species is driven by a high-expression promoter, and ChIP experiments were performed as in Figure 1. Only genes with 1:1 orthologs between S. cerevisiae and C. albicans are shown.

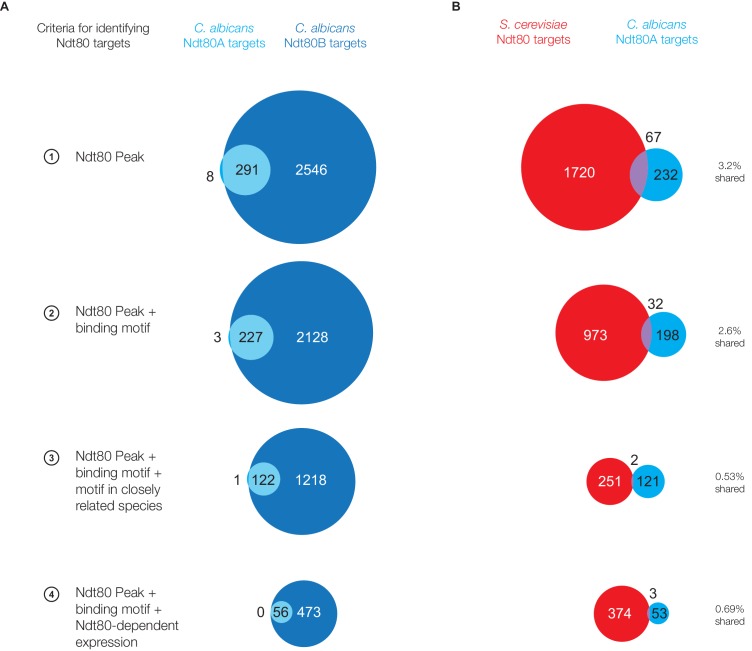
Figure 1—figure supplement 3. Ndt80 targets for paralogs Ndt80A and Ndt80B in C. albicans.

Figure 1—figure supplement 3.

(A) Ndt80 targets identified for Ndt80A (light blue) and Ndt80B (dark blue) in C. albicans using four different criteria (Figure 1C). (B) Targets of Ndt80A in C. albicans compared to the targets of Ndt80 in S. cerevisiae.

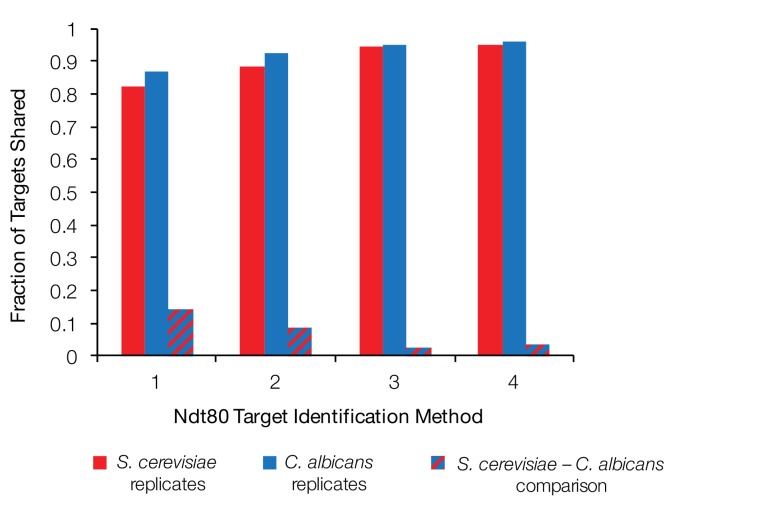
Figure 1—figure supplement 4. Fraction of Ndt80 targets shared between biological replicates and between S. cerevisiae and C. albicans.

Figure 1—figure supplement 4.

Fraction of Ndt80 ChIP-Seq targets shared between two biological replicates of S. cerevisiae (red), two biological replicates of C. albicans (blue), and between the intersections of the replicates for each species (dashed), using four different criteria (Figure 1C). Ndt80 expression in each species is driven by a high-expression promoter, and ChIP experiments were performed as in Figure 1.