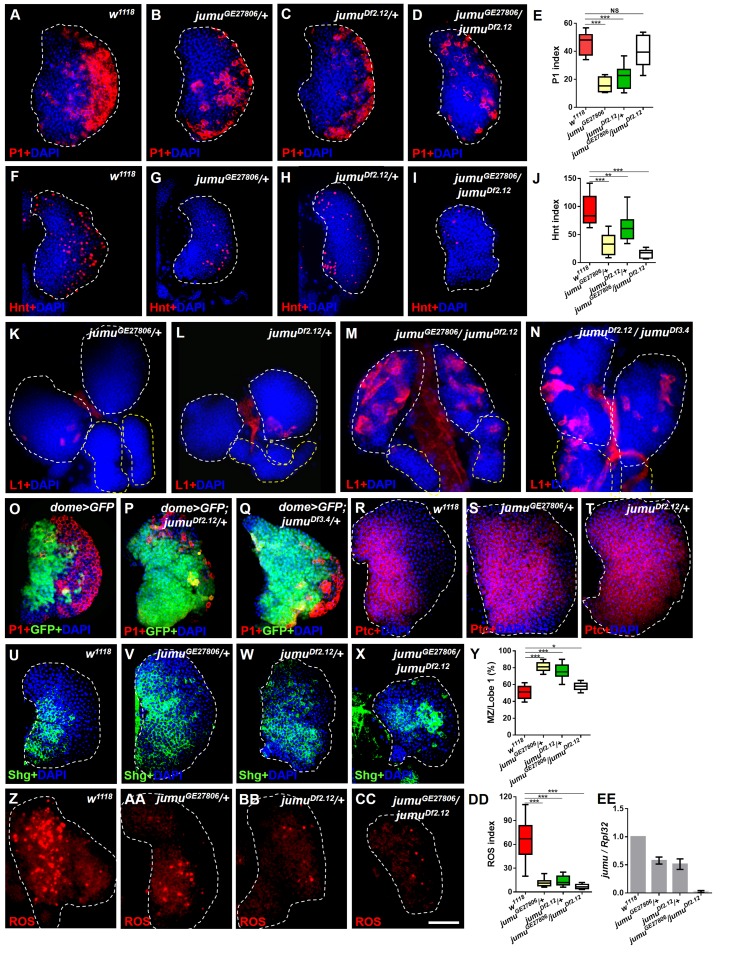
Figure 1. Loss of jumu affects prohemocyte differentiation in the lymph gland.
(A–D) Immunostaining against the plasmatocyte marker P1 (red) in the lymph glands of third-instar larvae. The numbers of plasmatocytes are significantly reduced in jumu heterozygotes but not obviously reduced in double heterozygotes mutants. (F–I) Immunostaining against the crystal cell marker Hnt (red) in the lymph glands of third-instar larvae. The numbers of crystal cells are significantly reduced in the mutant flies. (E, J) Quantification of plasmatocyte and crystal cell indexes in primary lobes. (K–N) Immunostaining against the lamellocyte marker L1 (red) shows few lamellocytes in jumu heterozygotes (K, L) and substantial increases in the lamellocyte number in jumu double heterozygotes mutants (M, N). (O–Q) The lymph glands of jumuDf2.12and jumuDf3.4 third-instar larvae display expansion of the medullary zone (MZ) as marked by dome>GFP (green) and a reduced plasmatocyte signal (red). (R–X) Immunostaining against Ptc (red) (R–T) and Shg (green) (U–X) shows MZ expansion in mutant third-instar larvae. (Y) Quantification of the proportions of the primary lobes occupied by prohemocytes (Shg+ MZ area/primary lobe area). (Z–CC) The ROS levels (red) are increased in the MZ of w1118third-instar larvae, but similar increases are rarely observed in mutant third-instar larvae. (DD) Quantification of the ROS+ cell index in primary lobes. (EE) Real-time PCR analysis of the jumu level in the entire third-instar larvae. The data are presented as box-and-whisker representations in E, J, Y and DD and as column-bar-graph representations (in which the error bars represent ± S.E.M.) in EE. For all quantifications: NS, not significant; *p<0.1; **p<0.01; ***p<0.001 (Student’s t test). Dashed white and yellow lines outline the edges of the primary and secondary lobes, respectively, in all of the figures. Scale bars: 50 μm.

