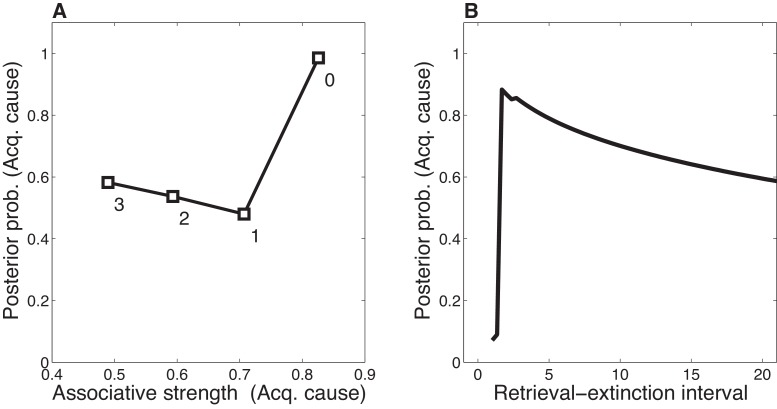
Figure 12. Dynamics of associative and structure learning during the retrieval-extinction interval in the Monfils-Schiller paradigm.
(A) The X-axis represents the associative weight corresponding to the acquisition latent cause. The Y-axis represents the posterior probability that the acquisition latent cause is active for the retrieval trial. Each numbered square indicates a particular iteration during the retrieval-extinction interval, with '0' indicating the last trial of acquisition. Initially, the prediction error causes the posterior to favor a new latent cause rather than the old acquisition cause, however, over the course of three iterations, incremental reductions in the associative weight pull the posterior probability higher by making the retrieval trial more likely under the acquisition cause. (B) As the retrieval-extinction interval grows longer, the probability of assigning the first extinction trial to the acquisition cause changes non-monotonically. Two non-reinforced trials very close in time are likely to come from a new latent cause, thus the posterior probability of the acquisition cause generating these trials starts low. It peaks at a larger retrieval-extinction interval; as this interval increases, the acquisition cause’s associative strength is incrementally reduced, thereby making the extinction trials more likely under the acquisition cause. The curve then gradually diminishes due to the time-sensitive prior that causes temporally separated events to be more likely to be generated by different causes (Equation 3). Each EM iteration takes a single timestep, and at least 1 EM iteration is always performed, up to a maximum of 3, depending on the intertrial interval.

