Figure 2.
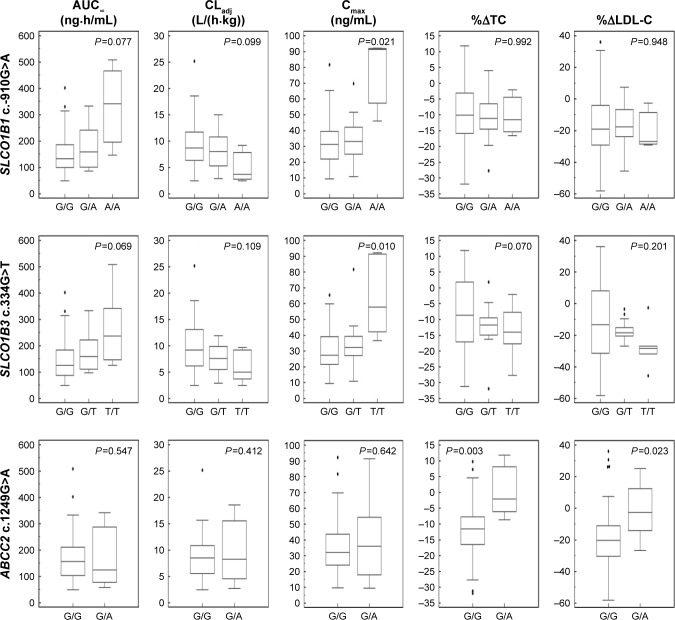
The pharmacodynamic and pharmacokinetic differences according to each genotype of SLCO1B1 c.-910G>A, SLCO1B3 c.334G>T, and ABCC2 c.1249G>A.
Notes: The box-and-whisker plots of the area under the plasma concentration curve from hour 0 to infinity (AUC∞), clearance adjusted with body weight (CLadj) and maximum concentration (Cmax) of atorvastatin, and percentage changes in total cholesterol (%ΔTC) and LDL-C (%ΔLDL-C) from baseline to 48 hours after atorvastatin administration according to genetic polymorphisms, are presented. There were differences in Cmax according to SLCO1B1 c.-910G >A and SLCO1B3 c.334G>T genotypes, and %ΔTC and %ΔLDL-C between G/G and G/A genotypes of ABCC2 c.1249G>A.

