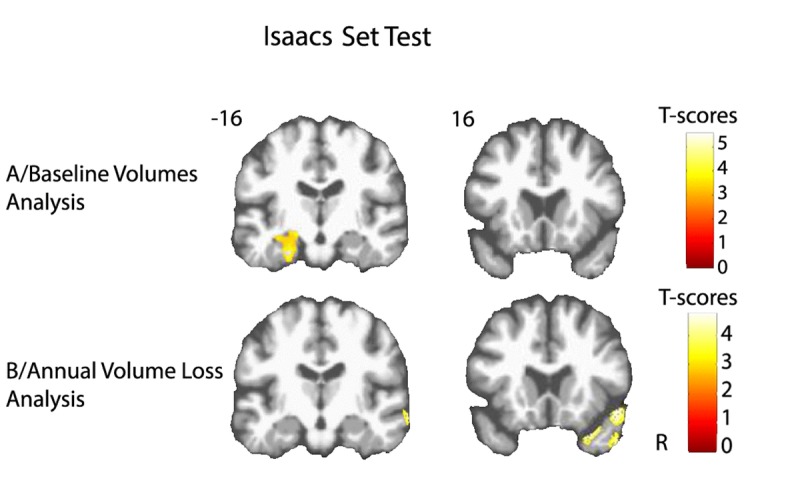
Figure 2. Cerebral substratum of semantic fluency decline.

(A) Transversal VBM analysis: grey matter volumes at baseline and fluency decline. (B) Longitudinal VBM analysis: grey matter annual rates of atrophy and fluency decline. Each model was adjusted for age, sex, level of education, APOE4 allele carrier status and total intracranial volume (except for longitudinal VBM analysis). Clusters presenting statistically significant associations (q<0.05, topological cluster FDR corrected) with variance of the fluency decline are overlaid on a spatially normalized TI image of one subject of the sample. Coordinates are given in millimeters in the MNI space. R = right side.
