
Figure 2.
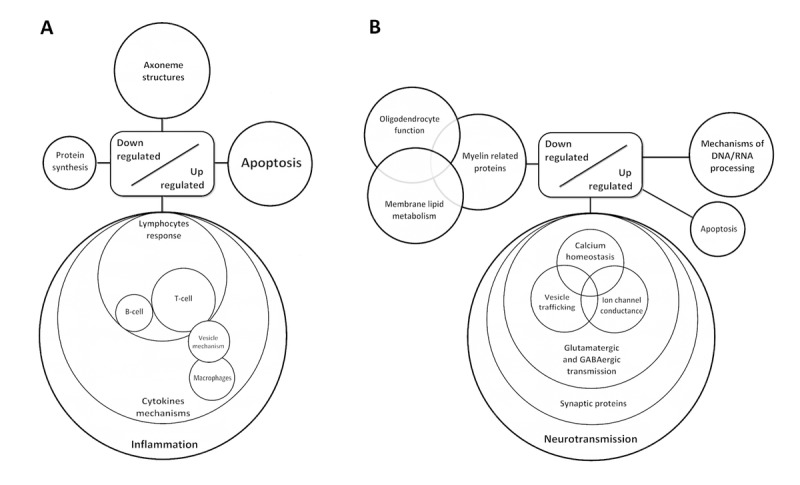
Diagram showing de-regulated gene clusters in the anterior horn of the spinal cord (A) and frontal cortex area 8 in ALS (B) as revealed by whole transcriptome arrays.
Official websites use .gov
A
.gov website belongs to an official
government organization in the United States.
Secure .gov websites use HTTPS
A lock (
) or https:// means you've safely
connected to the .gov website. Share sensitive
information only on official, secure websites.
Diagram showing de-regulated gene clusters in the anterior horn of the spinal cord (A) and frontal cortex area 8 in ALS (B) as revealed by whole transcriptome arrays.