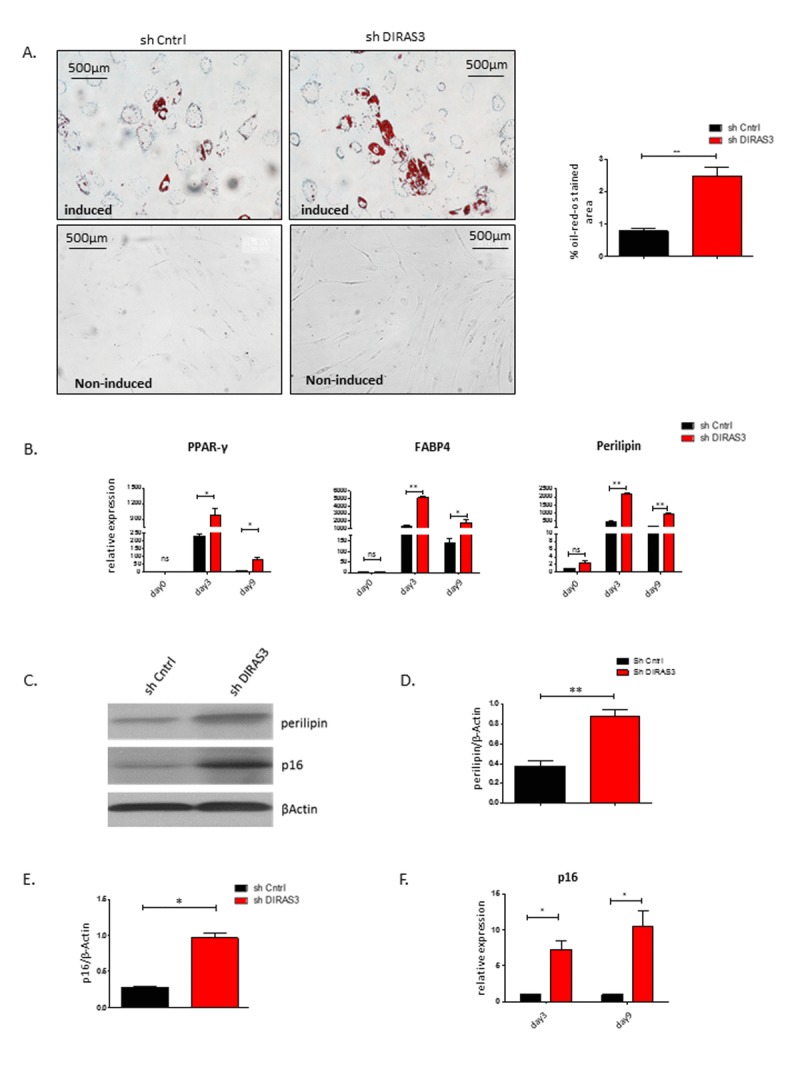
Figure 6. Silencing of DIRAS3 in ASCs induces both premature senescence and adipogenic differentiation.

(A) (Left panel) Adipogenic differentiation of ASCs was estimated by staining the cells with Oil-Red-O stain at day 9 post induction of differentiation. Non-induced ASC controls are shown. (Right panel) Quantification of Oil-Red-O stained area using image J is shown (n=3). (B) Expression of PPARγ2, FABP4 and Perilipin mRNA was estimated at day 3 and day 9 post induction of adipogenesis. Expression at day 0 before induction was taken as 1 and fold increase was calculated. Values are normalized to β Actin. (C) Perilipin and p16INK4A protein levels were analysed in DIRAS3 KD and control ASCs at day 9 post induction of adipogenesis by western blotting. β-Actin protein served as input control. (D and E) Densitometric evaluation of western blots bands from figure C. Fold changes in densitometric band intensities of perilipin (D) and p16INK4A (E) normalized to β-Actin protein, acquired by image J were plotted. (F) p16INK4A mRNA expression was analysed in DIRAS3 KD (red) and control ASCs (black) at day 3 and 9 post adipogenesis induction by q-RT_PCR analysis. All error bars represents the means ± SEM. p values * = p<0.05, **= p<0.001 and *** = p<.0001.
