
Fig. 1.
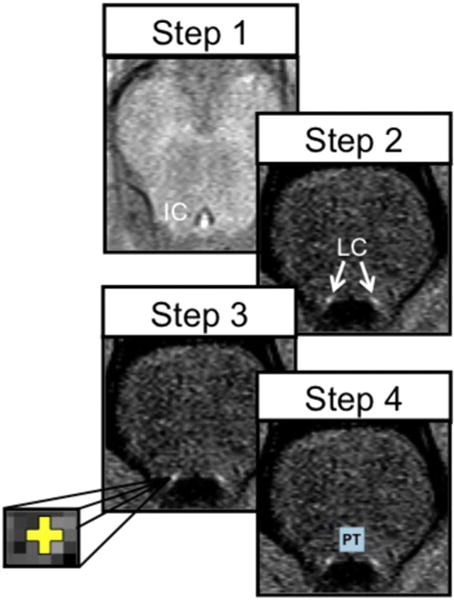
The steps used to delineate the LC regions of interest (ROIs). Step 1: In the axial plane, we identified the most inferior slice of the inferior colliculus (sagittal slices were also referenced to help identify the inferior-most portion of the inferior colliculus); Step 2: We then moved down 7 mm (2 slices) to a slice where LC should be most visible based on previous findings; Step 3: We drew a cross that was three voxels wide and three voxels tall and centered on the peak intensities of the left and right LC (each voxel was 0.429×0.429 mm2); Step 4: Six voxels above the more ventral of the two LC ROIs and equidistantly between them, we drew a reference 10×10 voxel square ROI in the dorsal pontine tegmentum to allow us to normalize the LC based on noise in the image. Figure reprinted from Clewett et al. (2016).