. 2016 Dec 27;55(5):463–469. doi: 10.1097/MLR.0000000000000685
Copyright © 2016 The Author(s). Published by Wolters Kluwer Health, Inc.
This is an open-access article distributed under the terms of the Creative Commons Attribution-Non Commercial-No Derivatives License 4.0 (CCBY-NC-ND), where it is permissible to download and share the work provided it is properly cited. The work cannot be changed in any way or used commercially without permission from the journal. http://creativecommons.org/licenses/by-nc-nd/4.0/
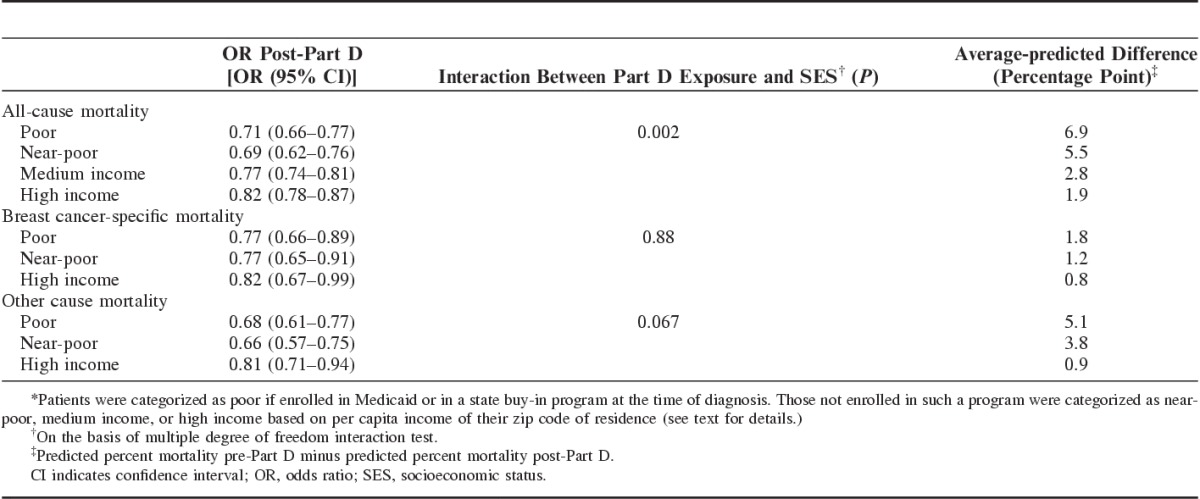
TABLE 3.
ORs and Average-predicted Mortality Differences by SES* and Part D Exposure

