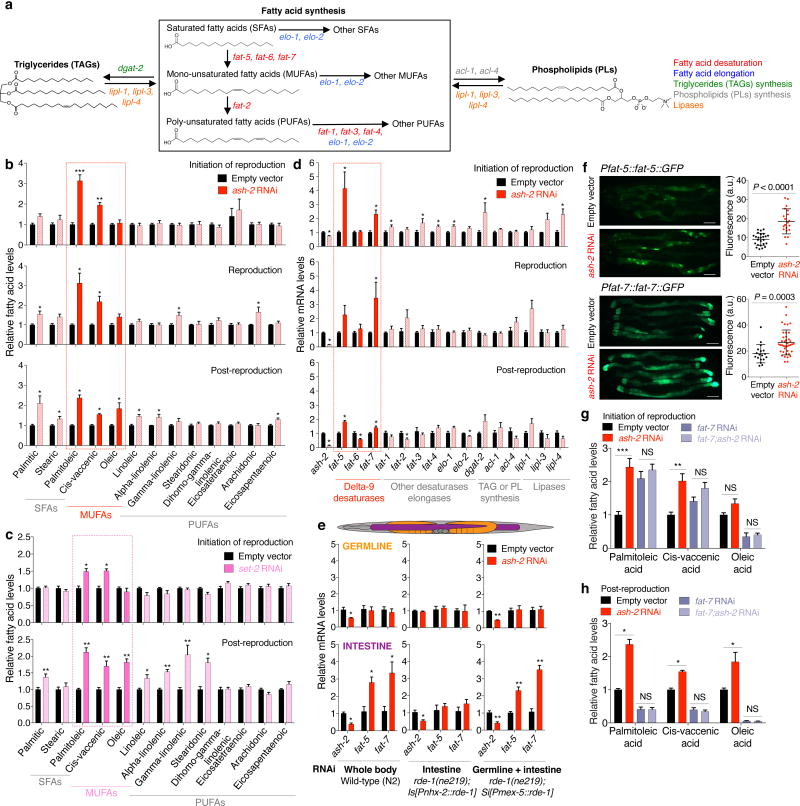
Figure 2. H3K4me3-methyltransferase deficiency results in elevated MUFAs and upregulation of delta-9 desaturases.
a, Fat metabolism pathways with genes used in RT-qPCR. b-c, GC-MS quantification of fatty acids. Mean ± s.e.m. of 2-3 independent experiments, each with 3 biological replicates. d, RT-qPCR. Mean ± s.e.m. of 2 independent experiments, each with 3 biological replicates. Solid red bars: delta-9 desaturases. e, RT-qPCR. Mean ± s.e.m. of 2 independent experiments, each with 2-3 biological replicates. f, Images and quantification of GFP fluorescence. Mean ± s.d., n ≥ 18 worms per condition. Representative of 2 (FAT-5) and 3 (FAT-7) experiments. Scale bar: 100 μm. g-h, GC-MS quantification of MUFAs. Mean ± s.e.m. of 3 (g) and 2 (h) independent experiments, each with 2-3 biological replicates. P values: Two-tailed Mann-Whitney (with Benjamini-Hochberg correction for > 2 conditions). * P < 0.05, ** P < 0.01, *** P < 0.001.

