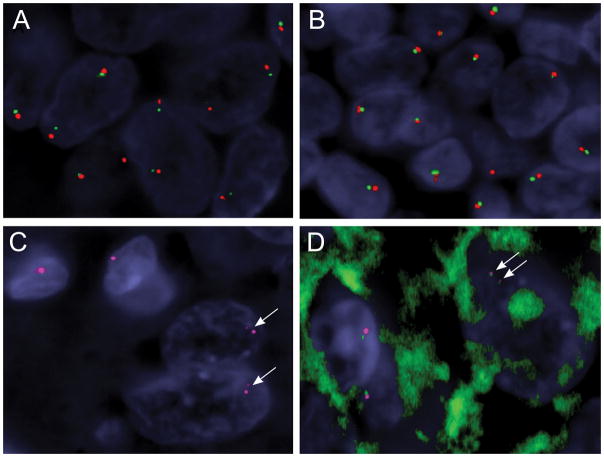
Figure 5.
Identification of RMB10-TFE3 fusion/inversion by the custom fosmid FISH assay, which is not detected by the standard BAC FISH assay resolution. (Case 2)
A,B. Conventional break-apart assay using typical flanking TFE3 probes (red, centromeric; green, telomeric) show small gaps in the tumor cells (A), compared to the normal lymphocytes adjacent to the tumor (B), but interpreted as a negative result in the clinical setting. However the small gaps may suggest the presence of a TFE3 cryptic inversion in the setting of strong TFE3 immunoreactivity and should trigger additional custom FISH assays to investigate a potential RMB10-TFE3 fusion (C, D).
C. Single color channel FISH using 2 fosmids flanking the TFE3 breakpoint (red) shows two split smaller red signals in the 2 tumor cells (lower right, arrows), in contrast to 2 normal cells showing one intact red signal (upper left).
D. Two-color fusion assay using custom fosmids showing 2 pairs of smaller red-green signals in keeping with a RBM10-TFE3 inversion in a tumor cell (upper right, arrows), compared to two normal cells showing only one pair of intact size red-green signals (lower left).

