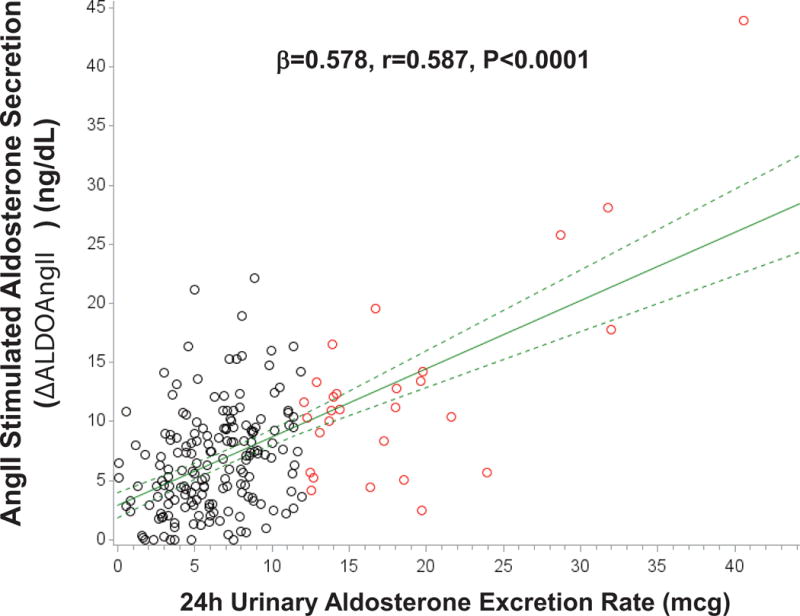
Figure 1. Association between 24h urinary aldosterone excretion and the adrenal aldosterone response to an infusion of angiotensin II.

Black circles represent normotensive participants without PA (24h urinary AER<12 mcg/24), red circles represent normotensive participants who fulfill the confirmatory criteria for PA (24h urinary AER≥12 mcg/24h), solid green line represents the mean regression line, and dotted green lines represent the 95% confidence intervals for the mean regression line. (AngII=angiotensin II)
