
Figure 3. The Relationship Between Autonomous Aldosterone Secretion, Renin, and Urinary Sodium-to-Potassium Excretion.
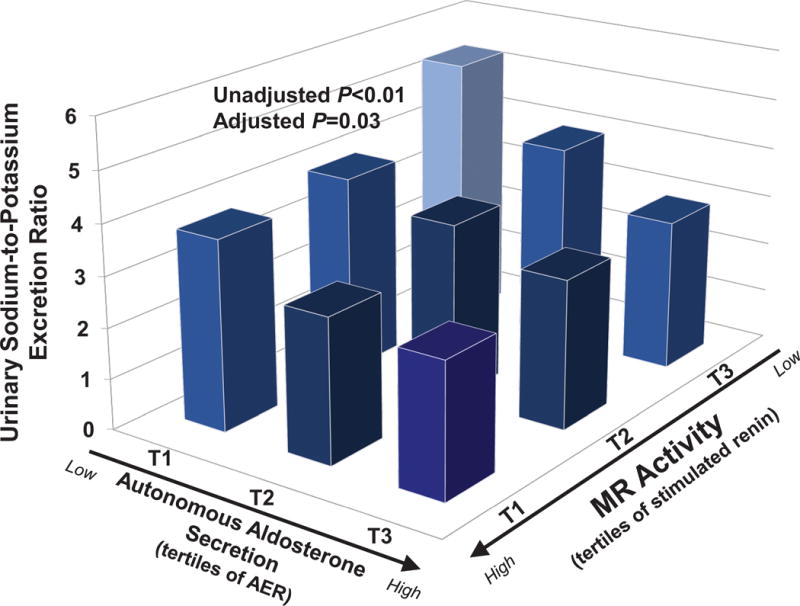
Autonomous aldosterone secretion is represented by tertiles of the 24h urinary aldosterone excretion rate measured on a liberalized dietary sodium intervention. Renin activity is represented by tertiles of renin when sodium restricted, whereby an inability to stimulate renin serves as a surrogate for excessive MR activity. The figure displays the interaction between the independent variables, aldosterone secretion and renin activity, and the dependent variable, urinary sodium-to-potassium excretion ratio. Bars represent the mean value in each tertile. The adjusted interaction model is adjusted for age, sex, race, body-mass index, and systolic blood pressure. (AER=24h aldosterone excretion rate; PRA=plasma renin activity)