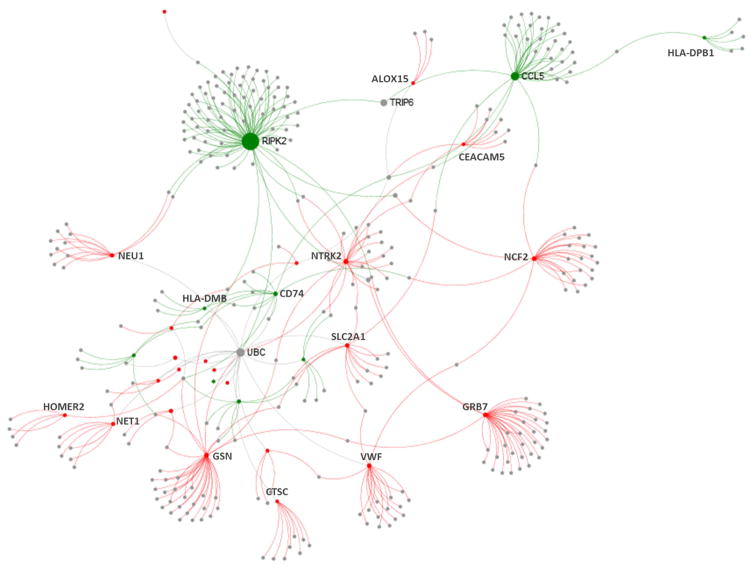
Figure 3.
Protein-protein interactome analysis of 47 allergic asthma-associated genes with inverse relationship of methylation and expression. The interactome was created using NetworkAnalyst(70) and the InnateDB PPI dataset. The nodes are colored based on their methylation and expression (green are downregulated and hypermethylated while red are upregulated and hypomethylated). The sizes of nodes are proportional to their betweenness centrality values.

