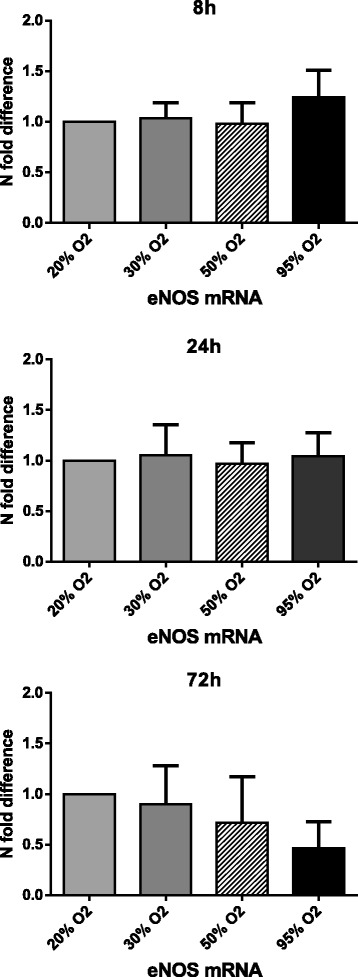
Fig. 3.

The effects of hyperoxia on eNOS mRNA expression. Gene expression of the eNOS gene was determined after 8, 24, and 72 h exposure under different oxygen concentrations. Data is expressed as N-fold difference with 20% O2 set as control (1.0). Mean ± SD; N = 4, all data non-significant (P > 0.05)
