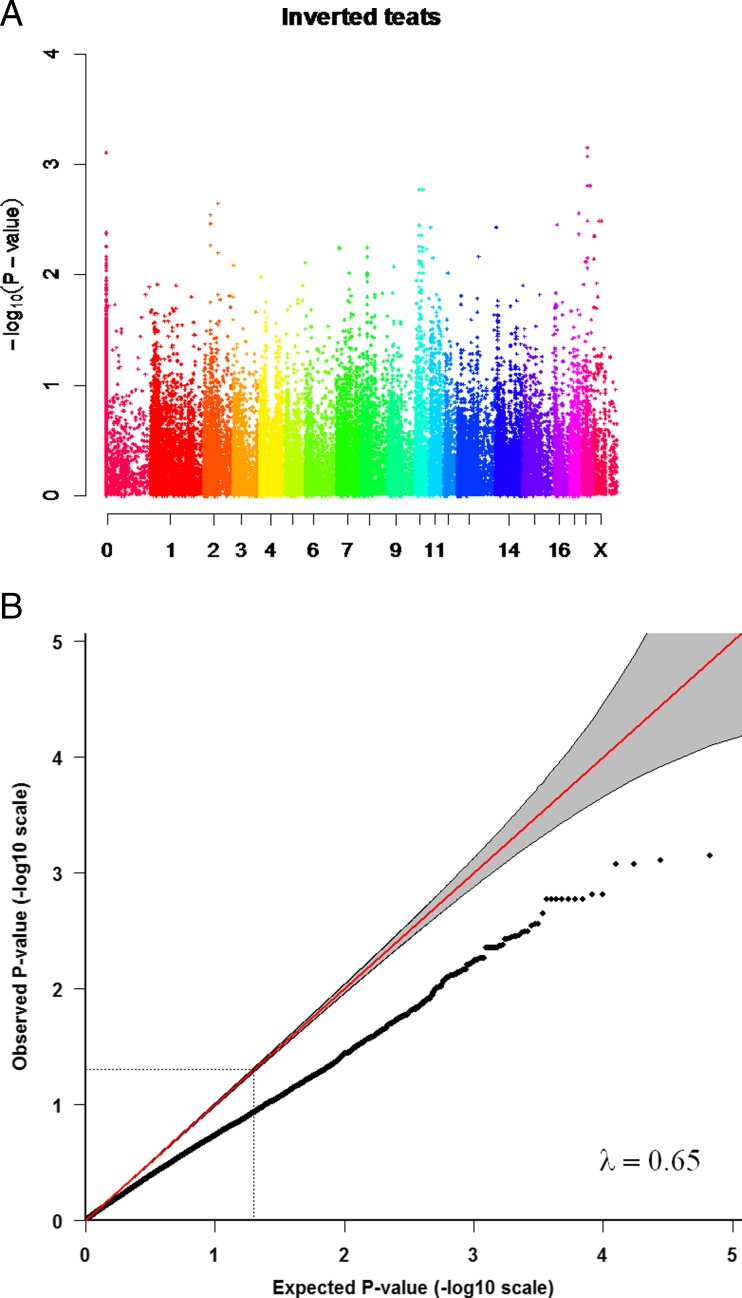
Fig. 1.
The association with the number of inverted teats and QQ-plot for the number of inverted teats. a Manhattan plot showing the negative logarithm of the p-value from the genome-wide association analysis for the number of inverted teats. Different colours represent chromosomes from 1 to X; results from unmapped markers not yet mapped to the pig reference genome are shown on the left side. b QQ plot from the GRAMMAR–Gamma analysis, inflation factor =0.65)

