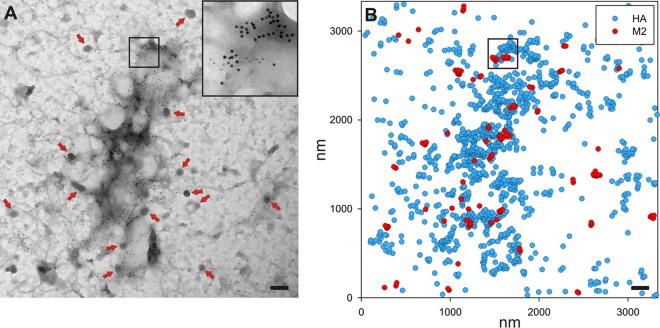
FIG 2.
Example of a membrane sheet used for analysis, stained for both M2 and HA. (A) A sheet of plasma membrane from MDCK cells infected with influenza virus A/Udorn/72 at 12 h p.i. that had been stained to show M2 (6-nm gold particles) and HA (12-nm gold particles). In all figures, the proteins identified by 6-nm gold particles are listed first, while those stained with 12-nm gold particles are listed second. To allow easier visualization of gold staining, the inset shows the boxed region of the image at a higher magnification. Clathrin-coated pits with the characteristic lattice structure (red arrows) are visible. (B) The positions of all gold labeling were used to create a list of x,y coordinates for use in subsequent analyses. A diagram of the gold labeling in panel A is shown, with the same area being boxed in both panels. Bars, 200 nm.

