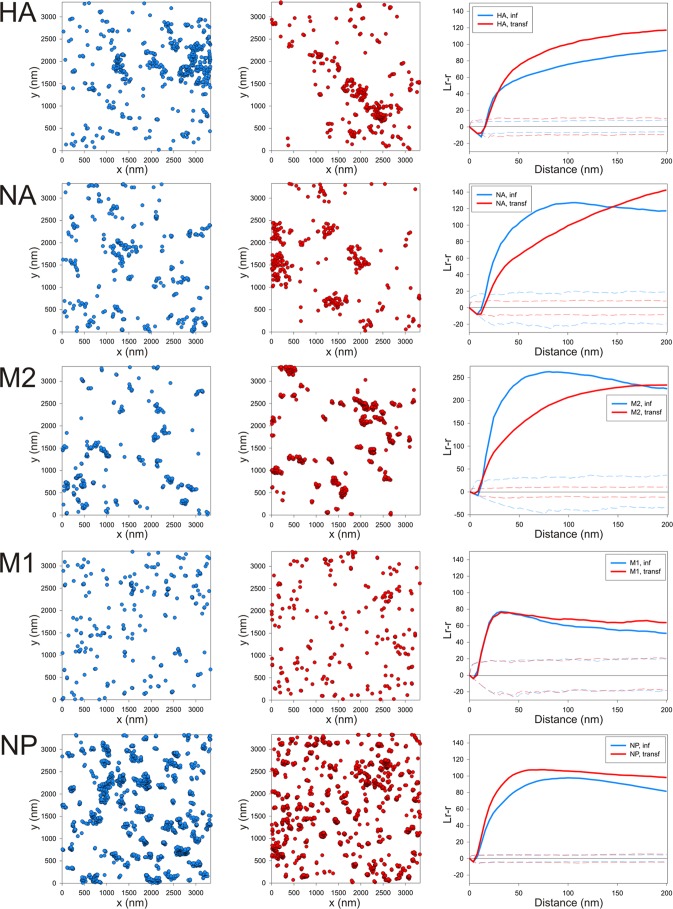
FIG 3.
Individual distributions of influenza virus proteins HA, NA, M2, M1, and NP in membranes prepared from Udorn virus-infected cells and cells transfected with DNA expressing the viral proteins. The distributions of the individual influenza virus proteins HA, NA, M2, M1, and NP are shown for infected (left) (blue) or transfected (middle) (red) cells. The average linear transformations from the Ripley analysis for the individual protein distributions are shown for the infected (inf) and transfected (transf) samples in the right-hand column. In this and subsequent figures, “transfected” indicates cells transfected with plasmid DNA expressing the indicated viral protein(s) (n = 2 under each experimental condition). Lr-r, L(r) − r, where L stands for the linear transformation of Ripley’s K function and r is distance, in this case radius.

