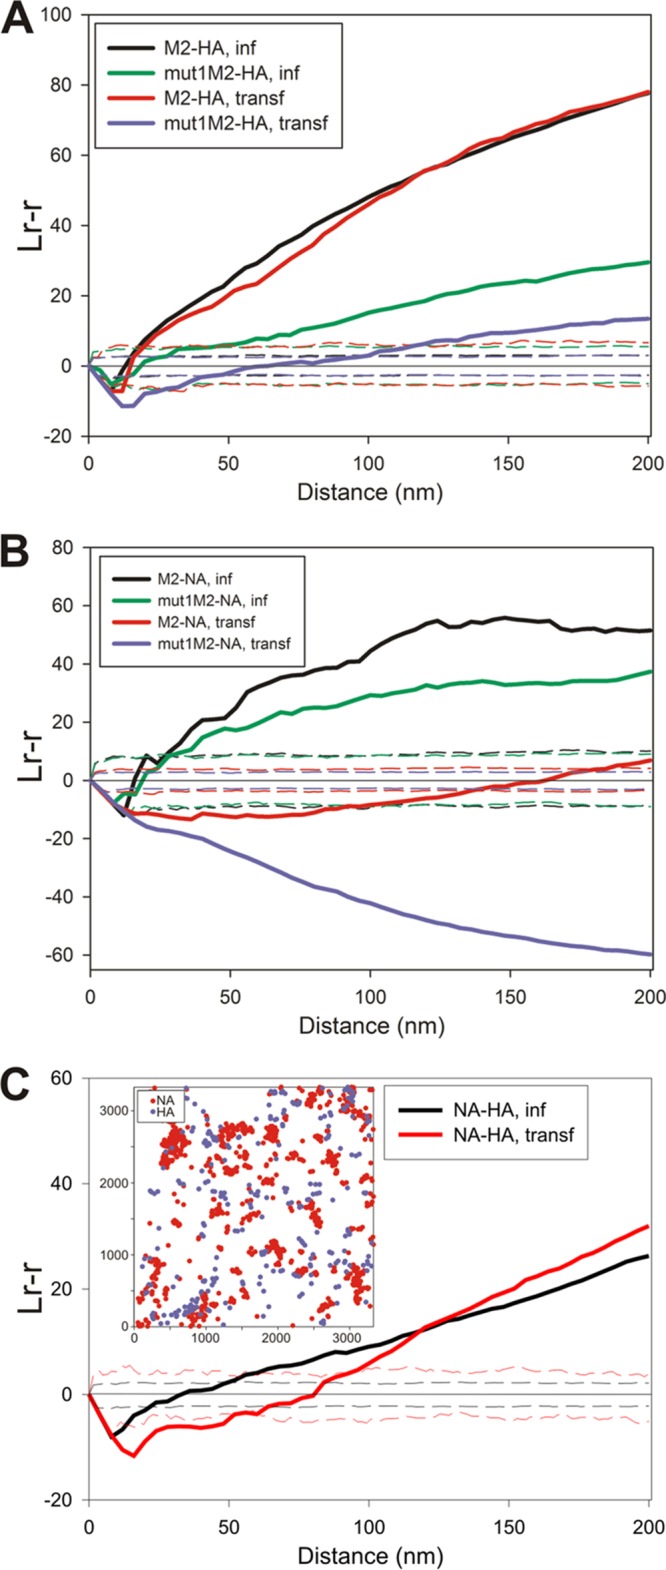
FIG 4.

Relative distributions of influenza virus cell surface-expressed proteins. Planar sheets of plasma membrane were prepared from either WSN-infected MDCK cells at 12 h p.i. or 293T cells at 24 h posttransfection. Membranes were labeled with immune reagents as described in Materials and Methods and examined by electron microscopy. (A) Analysis of the density of HA (12-nm gold particles) surrounding each M2 protein (6-nm gold particles) for a maximum radius of 200 nm, presented as an average linear transformation of data from a bivariate Ripley analysis. The distributions of both wild-type M2 and mut1M2 relative to HA were examined in virus-infected MDCK and transfected 293T cells (n = 5 for M2-HA in infected cells, n = 4 for mut1M2-HA in infected cells, n = 4 for M2-HA in transfected cells, and n = 3 for mut1M2-HA in transfected cells). (B) Distributions of M2 or mut1M2 (6-nm gold particles) and NA (12-nm gold particles) in virus-infected and transfected cells were compared by Ripley analysis (n = 4 for M2-NA in infected cells, n = 4 for mut1M2-NA in infected cells, n = 2 for M2-NA in transfected cells, and n = 2 for mut1M2-NA in transfected cells). (C) The spatial arrangements of HA (12-nm gold particles) and NA (6-nm gold particles) were compared to each other in virus-infected and transfected cells. The inset shows a graphical representation of the gold particle distribution for a representative image showing the separate but juxtaposed domains occupied by HA and NA, as described by the bivariate Ripley analysis (n = 3 for NA-HA in infected cells, and n = 4 for NA-HA in transfected cells).
