FIG 6.
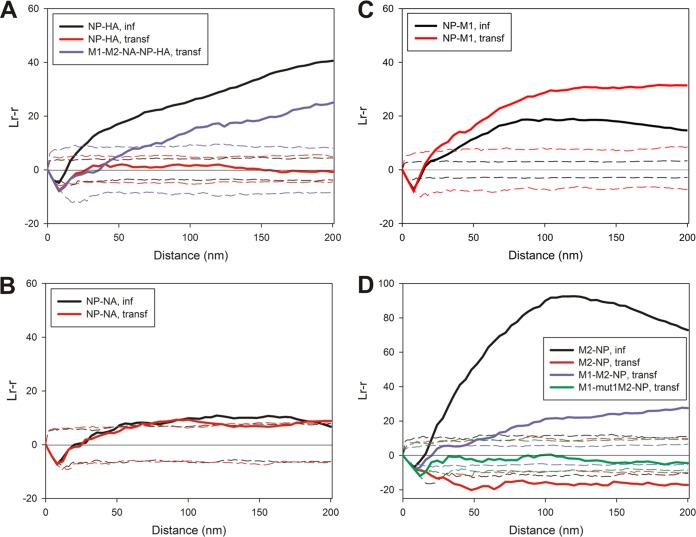
Spatial relationship of membrane-associated NP relative to HA, NA, M2, or M1. (A) Distribution of NP (6-nm gold particles) compared to that of HA (12-nm gold particles) in infected and transfected cells. The results of a bivariate Ripley analysis of NP and HA staining are also shown for 293T cells, which were transfected to express M1, M2, NA, NP, and HA (n = 3 for NP-HA in infected cells, n = 3 for NP-HA in transfected cells, and n = 3 for M1-M2-NA-NP-HA in transfected cells). (B and C) Relative positions of NP (6-nm gold particles) and NA (12-nm gold particles) (B) or NP (6-nm gold particles) and M1 (12-nm gold particles) (C) in membranes prepared from infected or transfected cells described by a bivariate Ripley analysis (n = 3 for NP-NA in infected cells, n = 3 for NP-NA in transfected cells, n = 4 for NP-M1 in infected cells, and n = 5 for NP-M1 in transfected cells). (D) Comparisons of the distributions of NP (12-nm gold particles) and M2 (6-nm gold particles) in infected and transfected cells. The degree of colocalization between NP and either M2 or mut1M2 cotransfected with M1 was also examined (n = 4 for M2-NP in infected cells, n = 5 for M2-NP in transfected cells, n = 2 for M1-M2-NP in transfected cells, and n = 2 for M1-mut1M2-NP in transfected cells).

