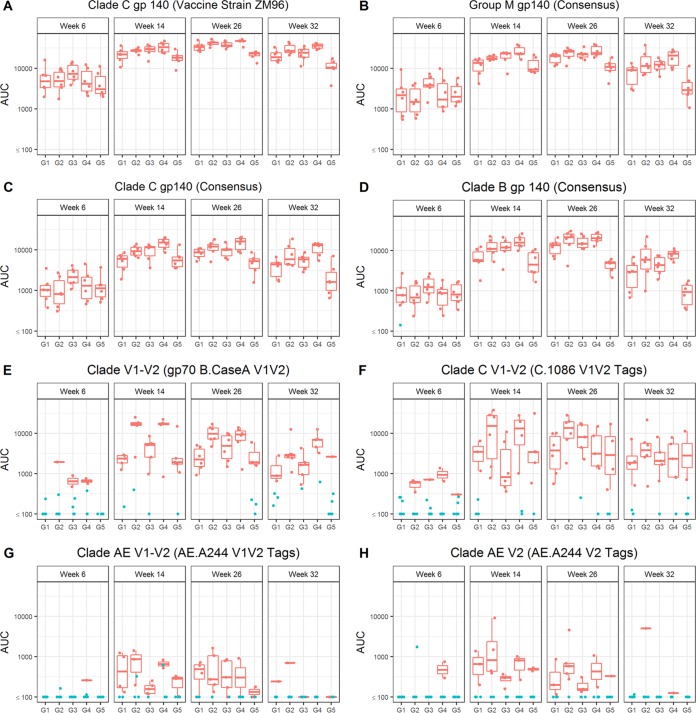
FIG 1.
Serum Env gp140-specific IgG responses elicited by anti-LOX-1.Env gp140 and anti-CD40.Env gp140 fusion protein administration. Total binding IgG antibody levels against clade C gp140 (vaccine strain ZM96) (A), group M gp140 (consensus) (B), clade C gp140 (consensus) (C), clade B gp140 (consensus) (D), clade B V1-V2 Env (gp70 B.CaseA V1V2) (E), clade C V1-V2 (C.1086C V1V2 tags) (F), clade AE V1-V2 (AE.A244 V1V2 tags) (G), and clade AE V2 (AE.A244 V2 tags) (H) induced by the different vaccination groups are shown. Individual serum samples were obtained at weeks 6, 14, 26, and 32 from each macaque (n = 6 per group) immunized as per G1 N2[LpN]2, G2 N2[CpN]2, G3 N2Lp2, G4 N2Cp2, and G5 N2C2 (Table 1). Binding antibodies were measured as indicated in Materials and Methods. The magnitudes of the antibody responses are expressed as the area under the curve (AUC) from serial dilutions of plasma. Each dot represents the value for one individual macaque. Weeks of sampling are indicated above each frame, and groups are defined below each frame. Blue points indicate nonresponders and red points responders. The midline of the box indicates the median, and the ends of the box indicate the 25th and 75th percentiles. The whiskers that extend from the top and bottom of the box extend to the most extreme data points that are no more than 1.5 times the interquartile range (i.e., the height of the box) or if no value meets this criterion, to the data extremes. Table 2 shows statistical analysis of paired comparisons of serum IgG responses against various Env antigens, including those shown in this figure.

