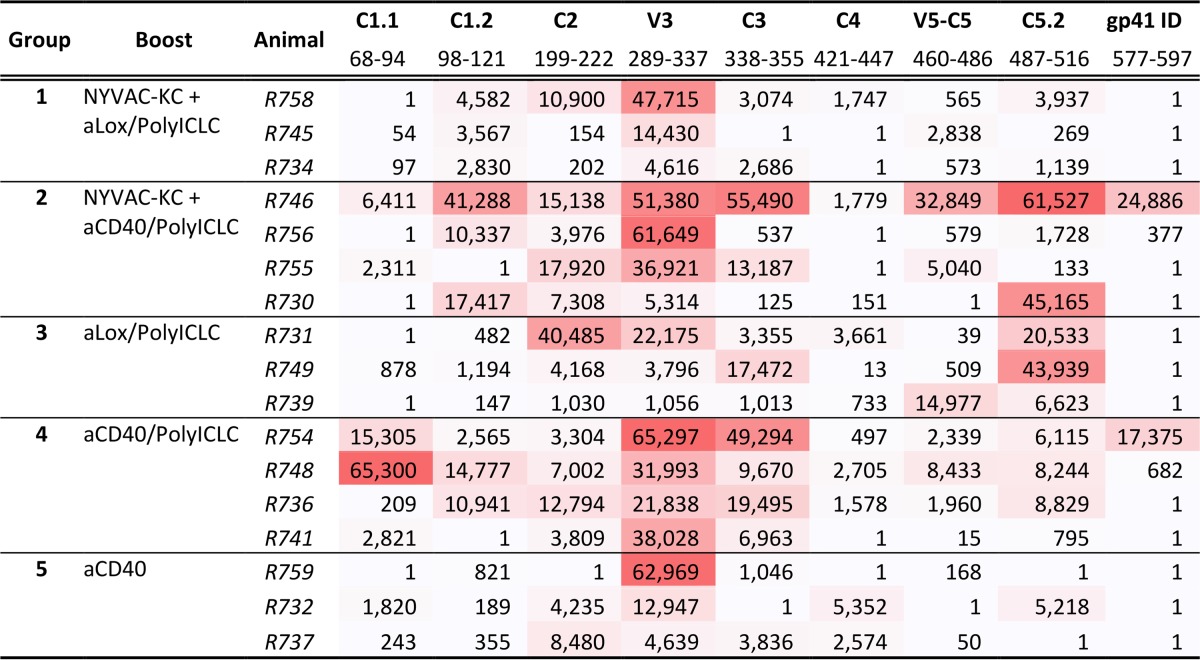
TABLE 3.
Binding magnitude to linear epitopes by plasma IgG from animals in groups 1 to 5 at the peak response time point (week 26)a
Epitope regions for gp120 are as shown graphically in Fig. 3 and here include data for the gp41 immunodominant (ID) region. Magnitude shown here are maximum binding per epitope, which is calculated as the highest signal intensity to a single peptide within a given epitope region. Shown below each epitope name is the location of each epitope, defined as the HXB2 amino acid number of the first amino acid of the first peptide in the epitope to the last amino acid of the last overlapping peptide in the epitope. Data are shaded with higher values in darker red. The rank order in higher values was G4 N2Cp2, G2 N2[CpN]2, G3 N2Lp2, and G1 N2[LpN]2/G5 N2C2.

