
TABLE 4.
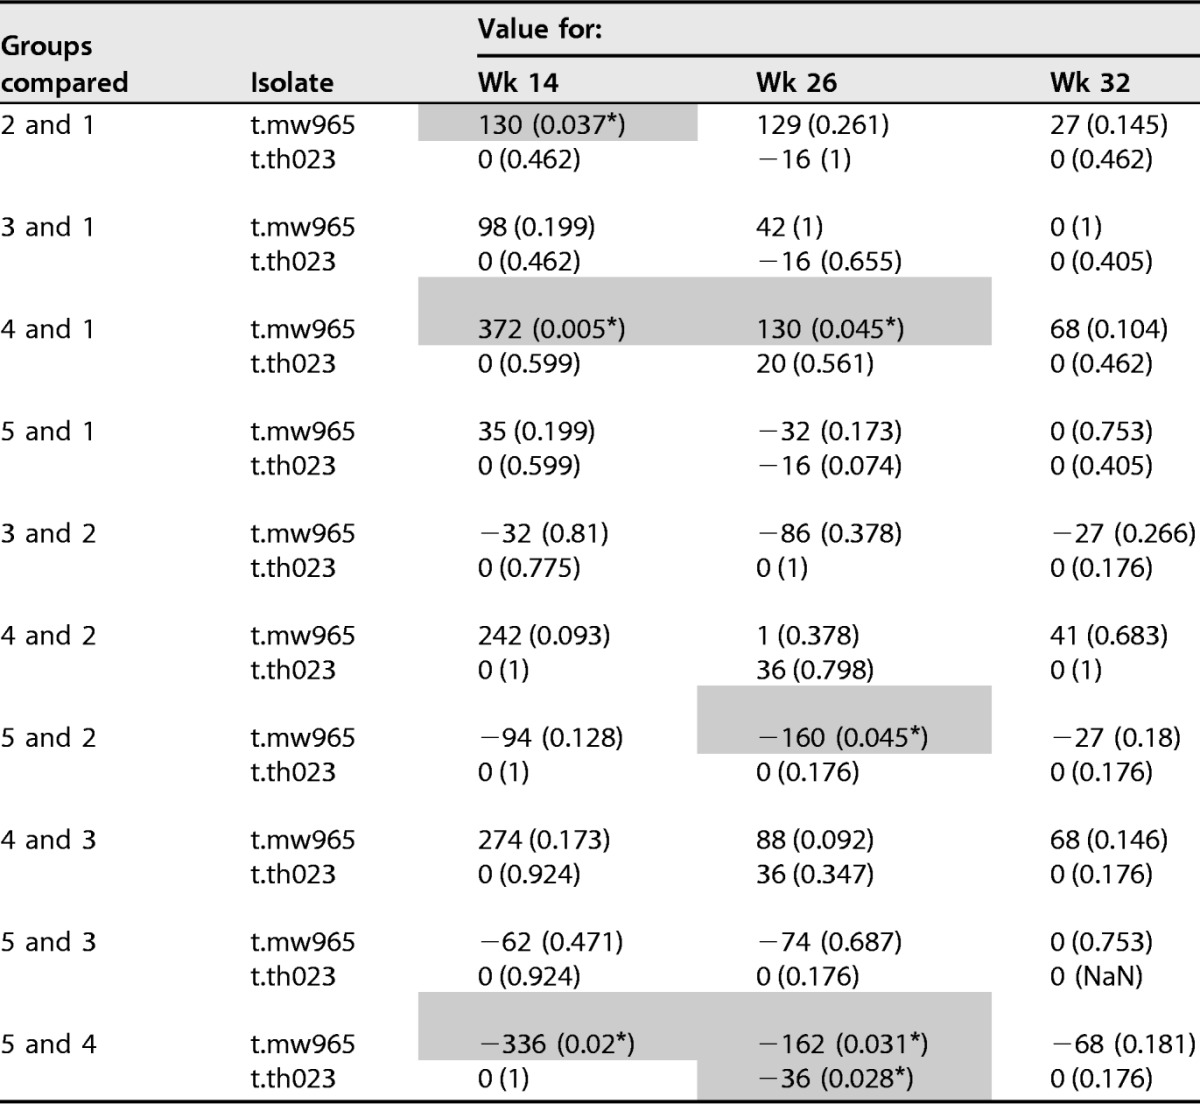
Comparison between paired groups for serum neutralizing responsesa
a
Neutralizaiton assay was performed with TZM-bl cells. Test results shown are median difference between groups followed by P value in parentheses. Analysis was done by Wilcoxon rank sum test. Values used for comparison are serum ID50 titers as shown in Fig. 4. Significant differences (P < 0.05) are shaded and indicated by an asterisk. Groups are G1 N2[LpN]2, G2 N2[CpN]2, G3 N2Lp2, G4 N2Cp2, and G5 N2C2.