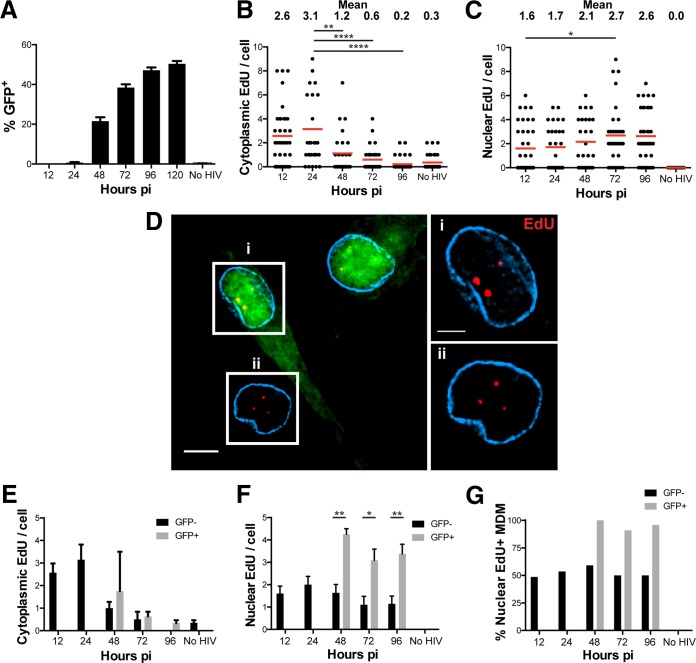
FIG 5.
Tracking HIV-1 nuclear import over time in productively and nonproductively infected MDM. (A) MDM were cultured with SIV-VLP for 16 h, infected with HIV-GFP for 12 h, washed, either fixed or cultured for the indicated times prior to fixation, and imaged for GFP expression. No HIV, SIV-VLP-treated and mock-infected cells. (B and C) MDM infected as described above for panel A were labeled for EdU, stained for lamin A/C (cyan), and imaged. The numbers of cytoplasmic (B) and nuclear (C) EdU puncta per cell were quantified at the indicated time points. (D, left) Representative z-section of cells in a single field at 96 h p.i. (Right) Boxed cells showing enlarged images of the same z-sections from the specified GFP+ (i) and GFP− (ii) cells. (E and F) The numbers of cytoplasmic (E) and nuclear (F) EdU puncta per cell stratified into GFP− and GFP+ MDM were extracted from the data in panels B and C by separating MDM based on their expression of GFP. (G) The percentage of GFP− and GFP+ MDM that contained any EdU was quantified. Cells under all conditions were quantified by using 25 to 30 cells except for panel A, where ∼1,000 cells were quantified for GFP expression. Error bars represent the standard errors from 6 to 9 random fields in panel A or from ∼30 cells in panels E and F. All data are representative of results from three independent experiments. A Mann-Whitney test was used to test for statistical significance in panels B and C, and Student's t test was used to determine statistical significance in panel F. *, P < 0.05; **, P < 0.01; ****, P < 0.0001. Bars, 5 μm (B, left) and 2.5 μm (B, right).

