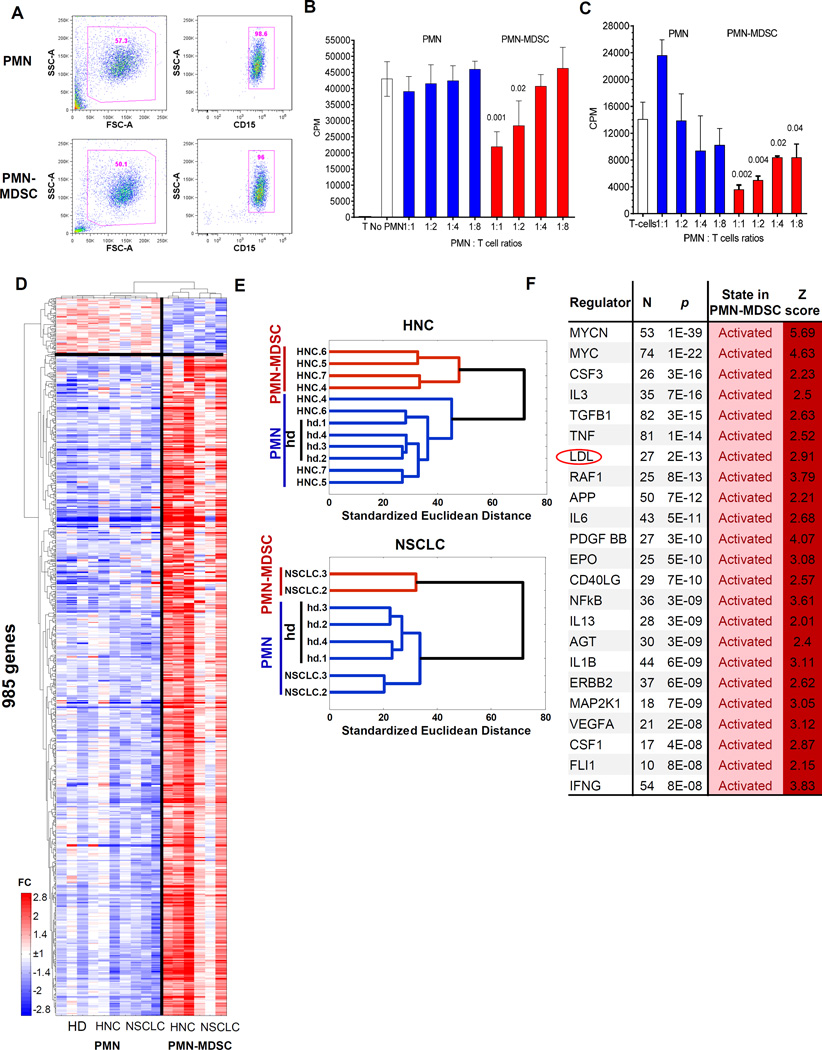
Figure 1. PMN-MDSC have distinct genomic signature.
A. Typical phenotype of PMN-MDSC and PMN isolated from peripheral blood of cancer patients using gradient centrifugation and CD15 beads; B. Suppression assay of PMN and PMN-MDSC isolated from the same patient with HNC. Allogeneic mixed leukocyte reaction was performed as described in Methods. Cell proliferation was evaluated in triplicates using 3H-thymidine uptake. Mean and SD are shown. p values are calculated in t-test from control – T cell proliferation without the presence of PMN or PMN-MDSC and shown on the graph, n=3 different patients. C. Suppression assay of PMN and PMN-MDSC isolated from the same patient with NSCLC. T-cell proliferation in response to CD3/CD28 was performed as described in Methods. Cell proliferation was evaluated in triplicates using 3H-thymidine uptake. Mean and SD are shown. p values are calculated in t-test from control – T cell proliferation without the presence of PMN or PMN-MDSC and shown on the graph, n=3 different patients. D. Relative expression heatmap and gene/sample clustering based on expression of 985 genes significantly differentially expressed (p<0.05, fold>2) between cancer patients’ PMN, PMN-MDSCs and PMN of healthy donors. E. Hierarchical clustering of PMN-MDSCs from HNC and NSCLC cancer patients indicates gene expression signature specific to PMN-MDSCs and similarities of PMN from cancer patients and PMN from healthy donors. F. Upstream Regulators identified by Ingenuity Pathway Analysis (IPA) among genes significantly differentially expressed between PMN-MDSC and PMN cells. N=number of genes from the category, Z=z-score of predicted activation state calculated by IPA.

