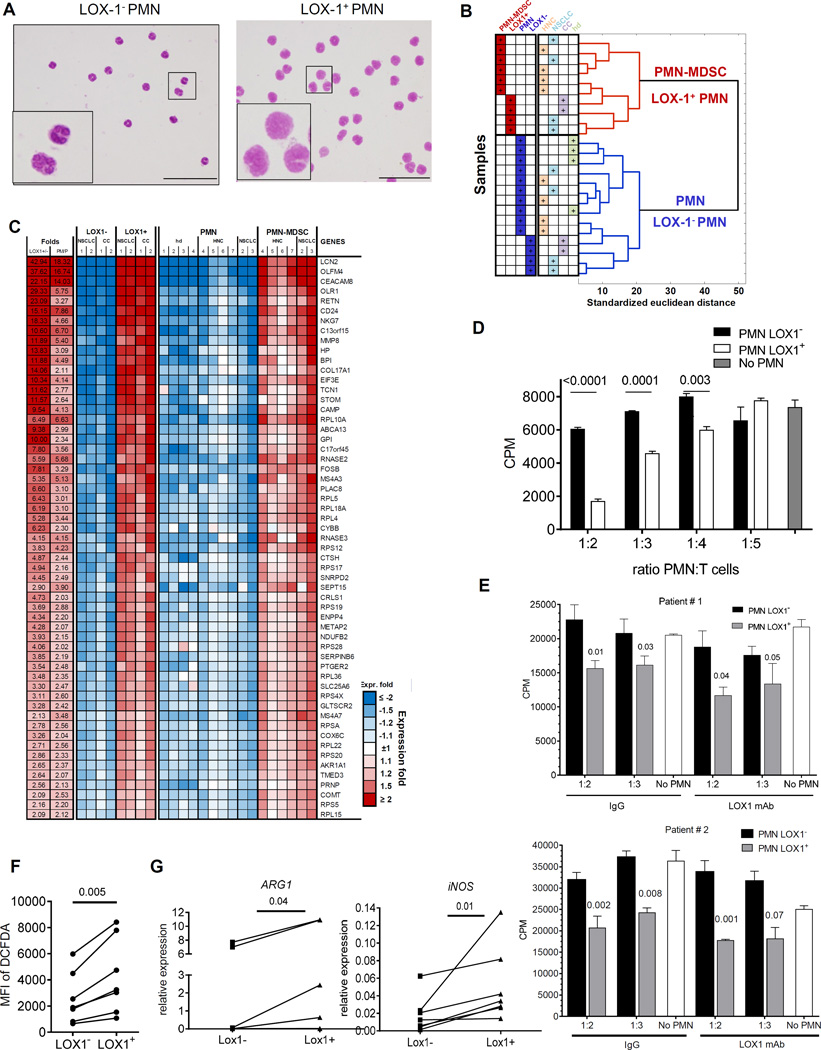
Figure 3. LOX-1 expression defines bona-fide PMN-MDSC.
A. Typical morphology of sorted LOX-1+ and Lox-1− PMN from patient with HNC. Scale bar = 20 µm. B. Hierarchical clustering of samples based on expression levels of genes differentially expressed between LOX-1+ and LOX-1− PMN. C. List and relative expression values of the most changed known genes overlapped between LOX-1+ and PMN-MDSC cells. D. Suppressive activity of LOX-1+ and LOX-1− PMN isolated from peripheral blood of patient with HNC in allogeneic MLR. Cell proliferation was evaluated in triplicates using 3H-thymidine uptake. Mean and SE are shown. p values in t-test from T cell proliferation without the presence of PMN are shown. Experiments with similar results were performed with samples from 9 patients with HNC and NSCLC. E. Effect of neutralizing LOX-1 antibody on suppressive activity of LOX-1+ PMN. PMN were isolated from two patients with NSCLC. LOX-1+ and LOX-1− PMN were isolated as described in Material and Methods and then added to allogeneic MLR in the presence of 10 µg/ml neutralizing mouse anti-human LOX-1 antibody or mouse IgG. Cell proliferation was evaluated in triplicates using 3H-thymidine uptake. Mean and SE are shown. p values in t-test from T cell proliferation without the presence of PMN are shown. F. ROS production in LOX-1+ and LOX-1− PMN from 7 patients with HNC and NSCLC. ROS production was measured by staining with DCFDA. G. Expression of ARG1 and NOS2 in LOX-1+ and LOX-1− PMN from 6 patients with HNC and MM measured by qPCR. P values in t-test are shown.

