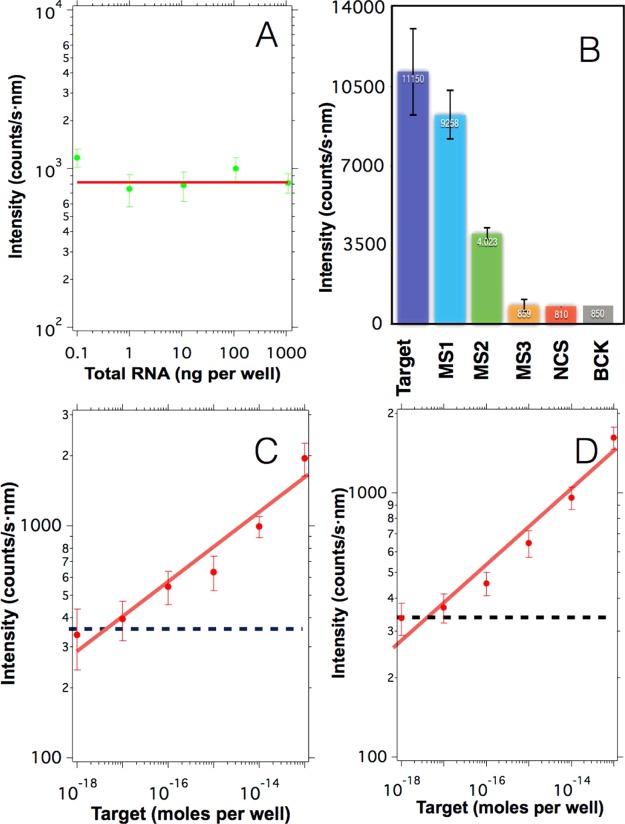
Figure 5.
A) Upconversion emission obtained from blank samples prepared in the presence of different amounts of total RNA from healthy mosquitoes and in the absence of target sequences. The red line indicates the average value 830 counts/s nm. (B) Upconversion emission obtained after hybridizing 1 μg of upconversion nanoparticles with 10–12 moles per well of different sequences: full complementary sequences (Target), a sequence containing a single mismatch in the middle (MS1), a sequence containing three mismatches in the middle (MS2), a sequence containing a single mismatch in the first quarter of the strand (MS3), noncomplementary sequences (NCS), and in the absence of target sequences (BCK). The error bars indicate the standard deviation obtained from the experiments. (C) Upconversion intensity obtained after spiking samples containing 100 ng of total RNA with varying concentrations of target sequences. (D) Upconversion intensity obtained after spiking samples containing human serum with varying concentrations of target sequences. The intensities in (C) and (D) were blank subtracted and the blue dashed line indicates the threshold resulting from three times the standard deviation of the control signal. In all graphs, the error bars indicate the standard deviation.

