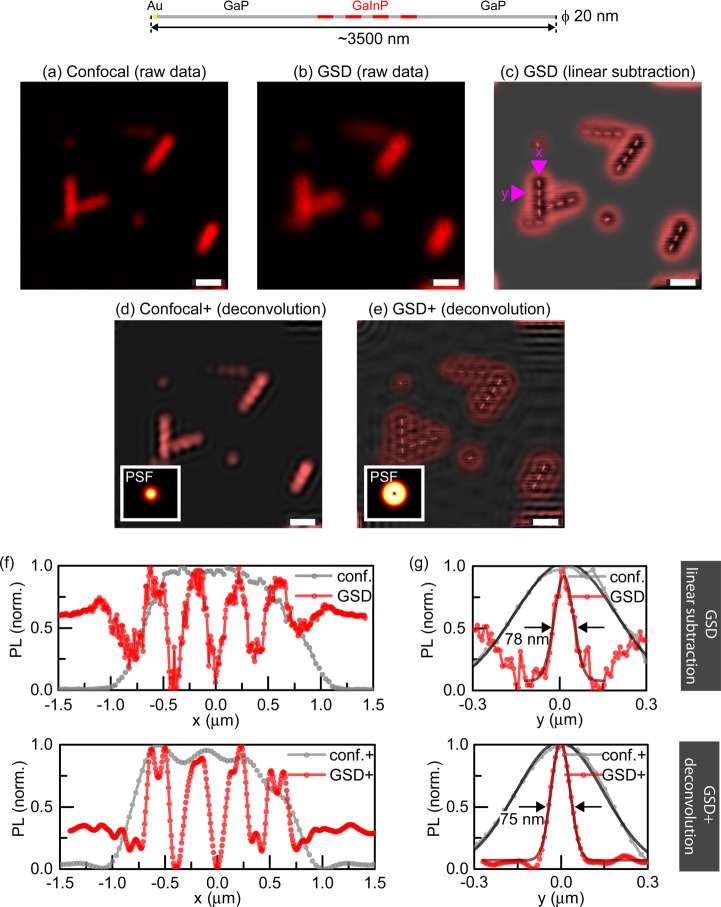
Figure 3.
Photoluminescence nanoscopy of barcode nanowires (ϕ = 20 nm) with long photoluminescent segments. (a) Nanowires imaged in confocal mode with an excitation wavelength of λ = 700 nm (b) The same nanowires imaged with GSD PL nanoscopy (excitation power 5 mW, excitation wavelength λ = 700 nm). (c) Restored image by subtraction of raw-data GSD image from its low-frequency counterpart (not shown). (d,e) Reconstructed confocal (d) and GSD (e) image by Wiener deconvolution algorithm with PSFs (insets) calculated analytically. (f,g) PL intensity line profiles along (x) and across (y) a NW to compare confocal and GSD images for (a,c) (top) and (d,e) (bottom), showing the resolution improvement in GSD nanoscopy. All scale bars: 1 μm.

