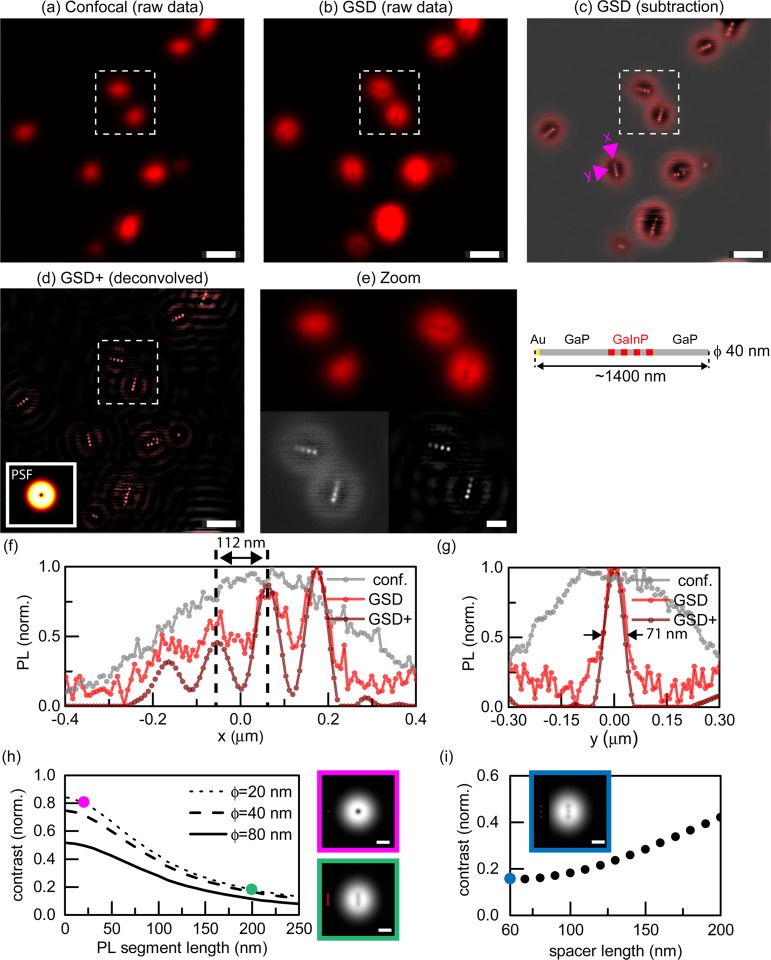
Figure 4.
Photoluminescence nanoscopy of barcode nanowires (ϕ = 40 nm) with short luminescent segments. (a) Nanowires imaged in confocal mode. Excitation wavelength λ = 700 nm. (b) The same area imaged by GSD PL nanoscopy with excitation power 3 mW. (c) Restored image by subtraction of raw-data GSD image from its low-frequency counterpart (not shown). (d) Reconstructed GSD image by Wiener deconvolution algorithm with PSF (inset) calculated analytically. (e) Enlarged views of selected image regions from (a–d) (GSD subtraction and deconvolved shown in greyscale for better visualization of achieved contrast). (f,g) Intensity profile lines along (x) and across (y) a NW indicated by pink arrows. (h) Simulated contrast for GSD imaging of an extended PL segment versus photoluminescence segment length (for different NW diameters ϕ). (i) Simulated imaging contrast dependence on separation between luminescent segments (at the middle segment). The modeled NW consists of three photoluminescence segments with diameter and length equal 20 nm. Images in (h,i) show the images calculated as a convolution of the objects (red) with the modeled PSF for 5 mW excitation power. Scale bars 1 μm (a–d), 200 nm (e,h,i).

