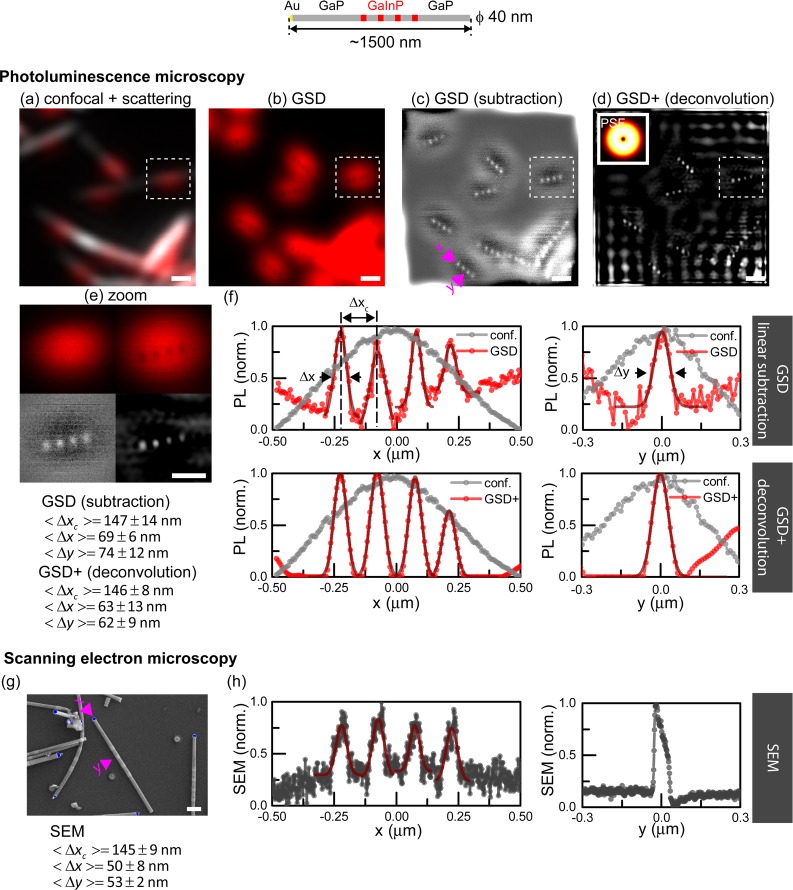
Figure 5.
Photoluminescence nanoscopy of barcode nanowires (ϕ = 40 nm) with short luminescent segments and larger spacers compared to NWs in Figure 4 to increase the contrast. (a) Nanowires imaged in confocal mode (excitation wavelength λ = 700 nm). (b) The same area imaged by GSD PL nanoscopy (excitation power, 5 mW). (c) Restored image by linear subtraction. (d) Deconvolved GSD image by Wiener deconvolution. The inset shows the PSF. (e) Enlarged view of selected image regions from (a–d). (f) Intensity profile lines along (x) and across (y) the NW indicated by pink arrows in (c). (g) Nanowires imaged by scanning electron microscopy (SEM). (h) Intensity profile lines along (x) and across (y) the NW indicated by pink arrows in (g). Symbols: Δxc, separation of adjacent maxima; Δx, length of segment; Δy, width of segment. Data tabulated in the bottom left margin compare GSD and SEM results for NWs from the same batch for more than seven segments. Scale bars 500 nm (a–d), 200 nm (e,g).

