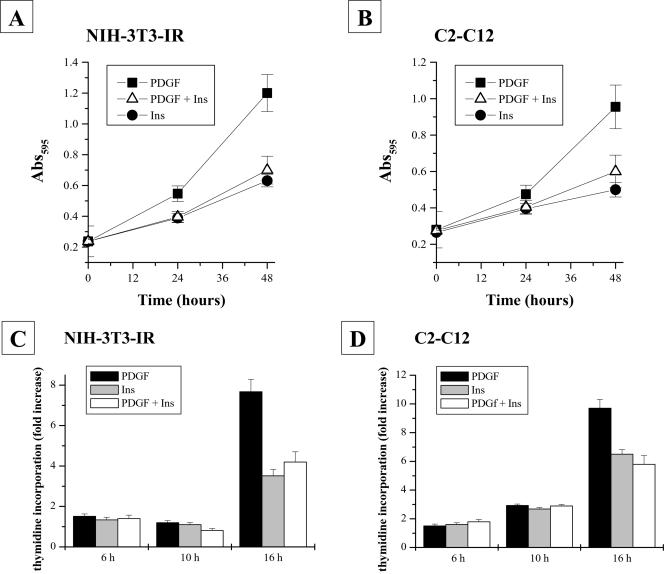
Figure 1.
NIH-3T3-IR and C2C12 cell growth rates after stimulation with platelet-derived growth factor, insulin, or platelet-derived growth factor together with insulin. Cells (2 × 10⁴) were seeded in 24-multiwell plates and serum starved for 24 h. Cells were then treated with 30 ng/ml platelet-derived growth factor and 10 nM insulin either separately or in combination for the times indicated. A and B show crystal violet staining experiments for NIH-3T3-IR and C2C12 cells, respectively. C and D report [3H]thymidine incorporation experiments in NIH-3T3-IR and C2C12 cells, respectively. All experiments were performed in triplicate.

