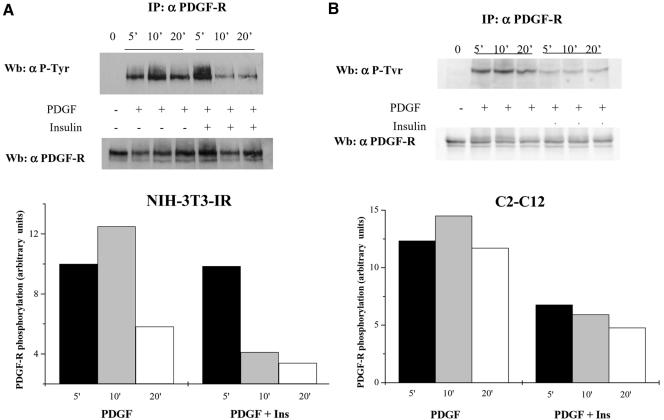
Figure 2.
Platelet-derived growth factor-R phosphorylation time course in NIH-3T3-IR (A) and C2C12 (B) cells stimulated with platelet-derived growth factor, insulin, or platelet-derived growth factor together with insulin. Cells (1 × 10⁶) were serum starved for 24 h before being treated with 30 ng/ml platelet-derived growth factor and 10 nM insulin or 30 ng/ml platelet-derived growth factor together with 10 nM insulin. At the indicated times, cells were lysed in RIPA buffer and immunoprecipitated with anti-platelet–derived growth factor-R antibodies. Immunoblots were first probed with anti-phosphotyrosine antibodies and then the blot was stripped and reprobed with anti-platelet–derived growth factor-R antibodies. The diagrams report the normalized platelet-derived growth factor-R phosphorylation under the various experimental conditions. The result is representative of three independent experiments with similar results.

