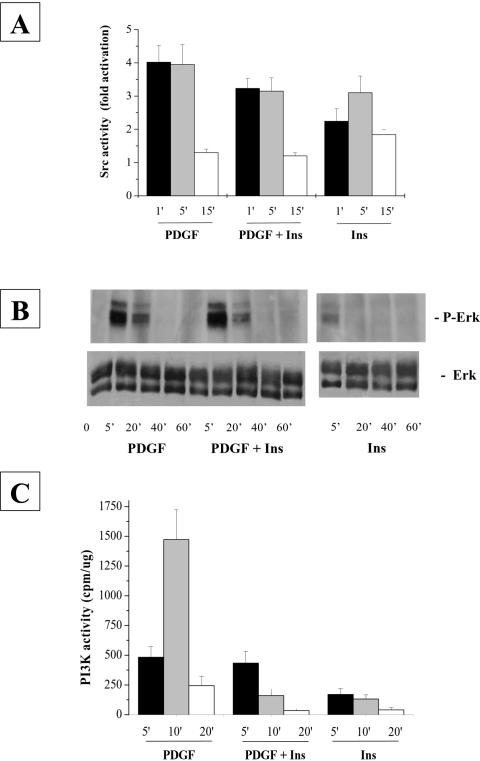
Figure 6.
Time course of Src kinase activity (A) and ERK phosphorylation (B) and PI-3K activity (C) after platelet-derived growth factor/insulin stimulation. (A) Src kinase activity assay: NIH-3T3-IR cells were serum starved for 24 h and then stimulated with 30 ng/ml platelet-derived growth factor and 10 nM insulin either separately or in combination. At the indicated times, cells were lysed in RIPA and immunoprecipitated with anti-Src antibodies and subjected to kinase assay as described in Materials and Methods. The result is representative of three independent experiments with similar results. (B) ERK phosphorylation: NIH-3T3-IR cells were treated as described above and lysed in RIPA buffer. ERK phosphorylation was determined resolving by 20 μg of lysates on a 12% SDS-PAGE. The proteins were transferred to PVDF membranes and probed with anti-phospho-ERK1/2 and anti-ERK1/2 antibodies The result is representative of three independent experiments with similar results. (C) PI-3K kinase activity assays: NIH-3T3-IR cells were treated as described above and lysed in RIPA buffer. PI-3K kinase activity was assayed as described in Material and Methods. The result is representative of three independent experiments with similar results.

