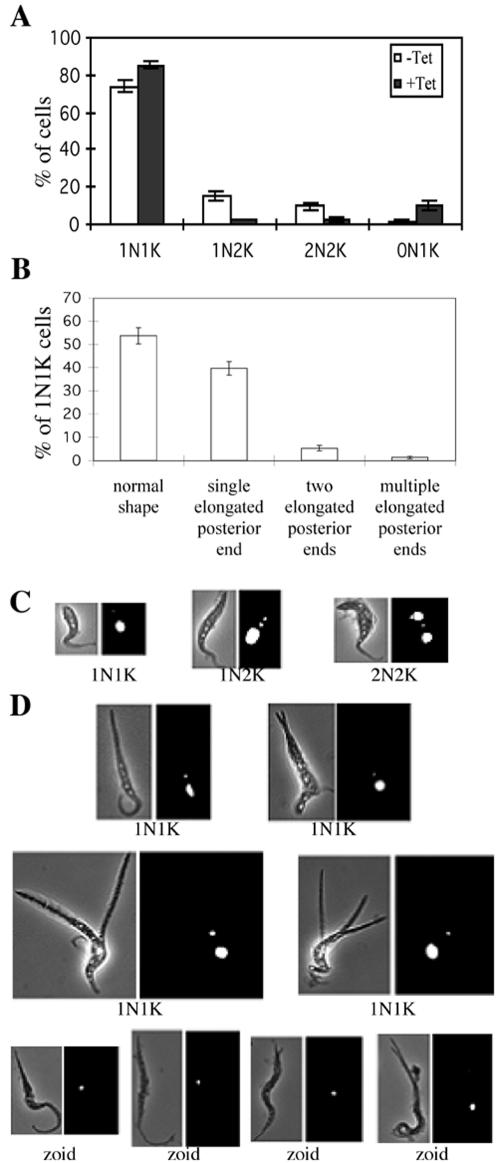
Figure 3.
Morphological phenotypes of CRK1+CRK2-deficient cells. Strain 29-13 cells after 5 d of RNAi for CRK1 and CRK2 were stained with PI and examined by fluorescence microscopy. (A and B) Quantification of cells (A) with different numbers of nuclei (N) and kinetoplasts (K) and (B) with different morphologies in the 1N1K population. Data are presented as the mean percentages ±SE for the total populations counted (>200 cells in each of three independent experiments). (C and D) Examples of different cell types identified in the wild-type (C) and CRK1+CRK2-depleted (D) populations. All cells are oriented with their posterior ends pointing upward.

