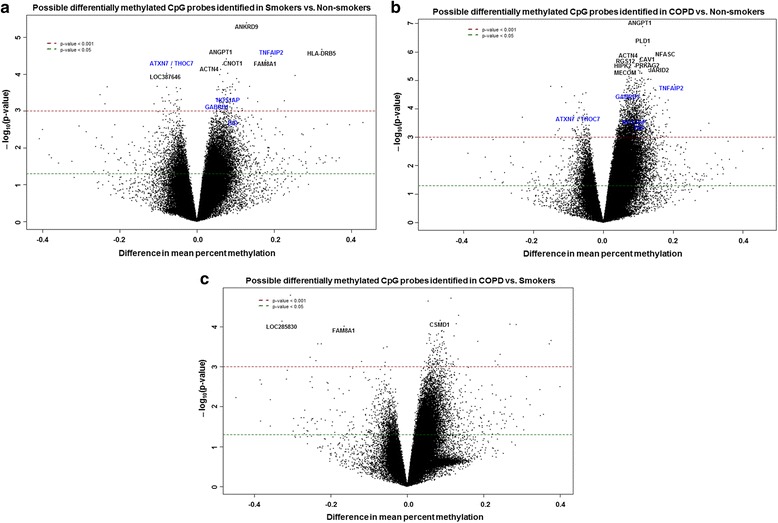
Fig. 2.

Volcano plots showing possible differentially methylated CpG sites identified in this study. a Differential methylation analysis revealed top 10 CpG sites and their genes significantly associated with smokers with P < 0.001. Difference in mean percent methylation represents the difference in mean methylation between smokers vs. non-smokers (control). b Differential methylation analysis revealed top 10 CpG sites and their genes significantly associated with COPD with P < 0.001. Difference in mean percent methylation represents the difference in mean methylation between COPD vs. non-smokers (control). c Differential methylation analysis revealed CpG sites and their genes significantly associated with COPD compared to smokers with P < 0.001. Difference in mean percent methylation represents the difference in mean methylation between COPD vs. smokers (control). The y axis represents the negative log P value of their association. The genes marked in blue color are the once validated by pyrosequencing analysis. The red and green dotted horizontal lines indicate the genome-wide significance threshold of P < 0.001 and P < 0.05, respectively. The top candidates in each pairwise comparison were selected by test statistics and unadjusted P values for comparisons (P < 0.001 is commonly used as a cutoff for relatively small unadjusted raw P value)
