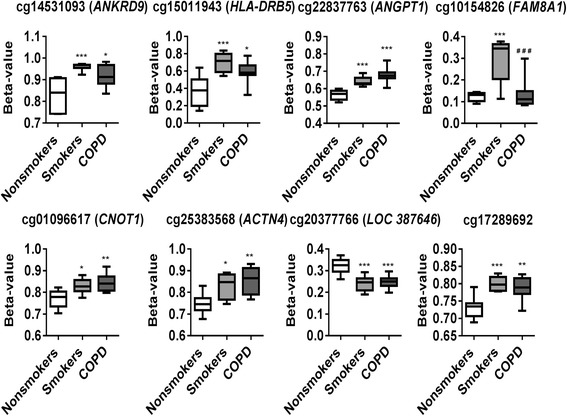
Fig. 4.

Differentially methylated CpG sites associated with smokers. Differential methylation analysis revealed CpG sites in genes significantly associated with smokers with a P value less than 0.05. Difference in mean beta values represents the difference in mean methylation between smokers and non-smokers (controls). The y axis represents the beta value. The gene symbol associated with CpG probes are provided in parenthesis. Data are represented as a box plot which displays the full range of variation (from min to max), the likely range of variation (the IQR) and a typical value (the median) for n = 8/group, and the significance determined using one-way ANOVA (Tukey’s multiple comparisons test). *P < 0.05, **P < 0.01, ***P < 0.001, vs. non-smokers; ### P < 0.001 vs. smokers
