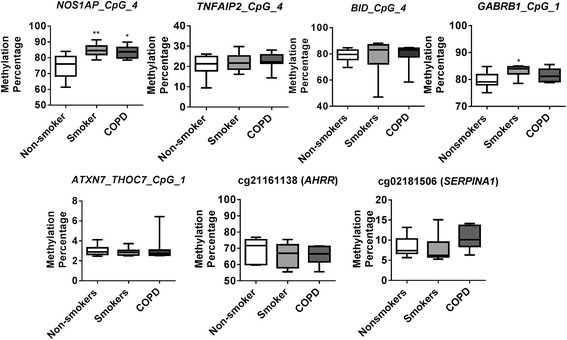
Fig. 8.

Pyrosequencing validation of CpG sites identified in genome-wide DNA methylation analysis. NOS1AP locus cg2663636, TNFAIP2 locus cg18620571, BID locus cg01388022, GABRB1 locus cg15393297, and ATXN7 and THOC7 locus cg07753241 were validated along with AHRR locus cg21161138 and SERPINA1 locus cg02181506. Boxplots represent pyrosequencing methylation percentages between smokers and COPD compared to non-smokers control. Data are represented as box plot which displays the full range of variation (from min to max), the likely range of variation (the IQR) and a typical value (the median) for n = 8/group, and the significance determined using one-way ANOVA (Tukey’s multiple comparisons test). *P < 0.05, **P < 0.01, vs. non-smokers
