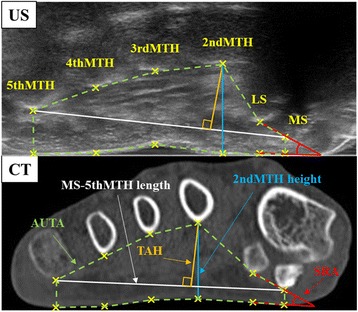
Fig. 3.

Forefoot structure images in the coronal plane obtained from ultrasonography (US) and computed tomography (CT). The six points of the bones, medial sesamoid bone (MS), lateral sesamoid bone (LS), 2nd metatarsal head (MTH), 3rdMTH, 4thMTH and 5thMTH, were marked. In addition to these six bone points, six plantar points were plotted under each bone point, and all parameters were measured. The length of the yellow line indicates the transverse arch height (TAH). The length of the blue line indicates the 2ndMTH height. The length of the white line indicates the length between the medial sesamoid bone and 5th metatarsal head (MS-5thMTH length). The angle composed of the red lines indicates the sesamoid rotation angle (SRA). The area surrounded by the green dashed line indicates the area under the transverse arch (AUTA). As the ultrasound waves cannot penetrate bones, the ultrasonogram of the forefoot demonstrates only the plantar surfaces of sesamoid bones and the 2nd through 5th MTHs
