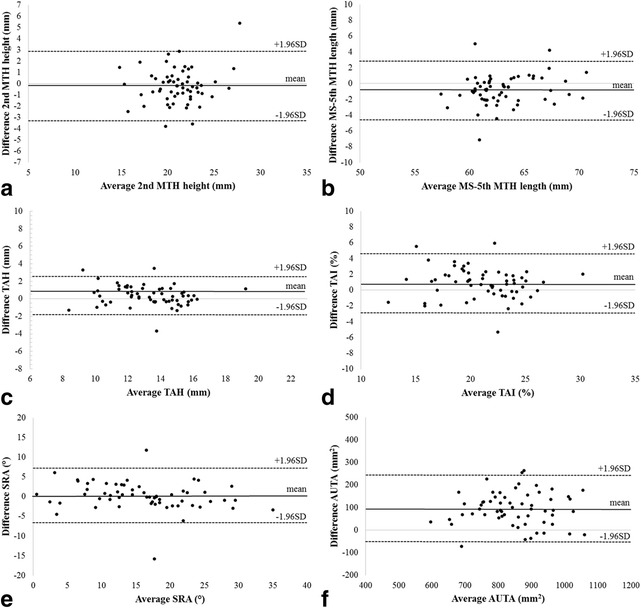
Fig. 4.

Bland-Altman plots comparing ultrasonography (US) and computed tomography (CT). The solid line shows the mean difference, whreas the dashed line shows 95% limits of agreement (LoA). a 2ndMTH height, b the length between the medial sesamoid bone and 5th metatarsal head (MS-5thMTH length), c transverse arch height (TAH), d transverse arch index (TAI), e sesamoid rotation angle (SRA) and f area under the transverse arch (AUTA)
