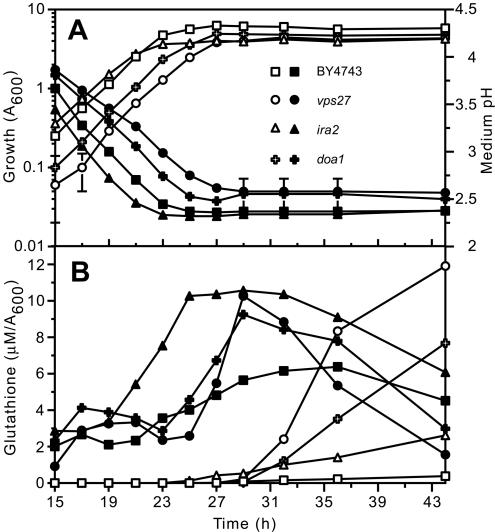
Figure 2.
Influence of growth phase on glutathione levels in the parental strain (BY4743) and representative glutathione-overexcreting mutants. The parent (squares) and representative glutathione-overexcreting mutants vps27 (circles), ira2 (triangles), and doa1 (crosses) were inoculated (A600 of 0.01) in SD medium and incubated at 30°C. (A) Growth (open symbols; A600) and medium pH (closed symbols; initial pH of medium was 4.5) and (B) intracellular glutathione (closed symbols; μM/A600) and extracellular glutathione (open symbols; μM/A600) were quantified at intervals between 15 and 44 h postinoculation as indicated.

