Figure 5.
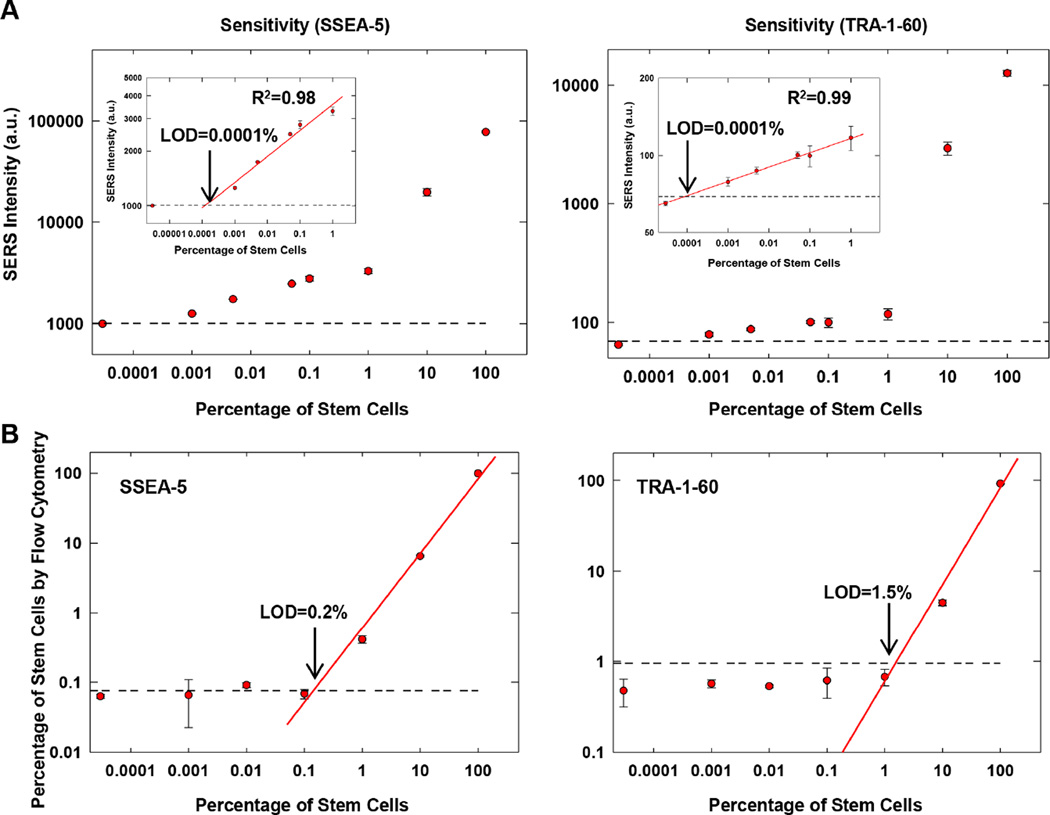
Sensitivity of SSEA-5-conjugated and TRA-1-60-conjugated nanoparticles for the detection of hPSCs. (A) Correlation between the relative SERS intensity from SSEA-5-conjugated nanoparticles or TRA-1-60-conjugated nanoparticles and the amount of stem cells in mixed cell preparations of hPSCs and NIH3T3 fibroblasts. SERS signals from nanoparticles bounded with cells were recorded and plotted against the concentration of stem cells. The horizontal line indicates the SERS intensity value that equals to the mean plus 3 standard deviations of the measurements of NIH3T3 cells. The LOD was determined as the concentration of stem cells at the intersection between the horizontal line and the standard curve. (B) Correlation between the percentage of SSEA-5+ or TRA-1-60+ cells detected by flow cytometry and the amount of stem cells in mixed cell preparations of hPSCs and NIH3T3 fibroblasts. The horizontal line indicates the value that equals to the mean plus 3 standard deviations of the measurements of NIH3T3 cells by flow cytometry.

