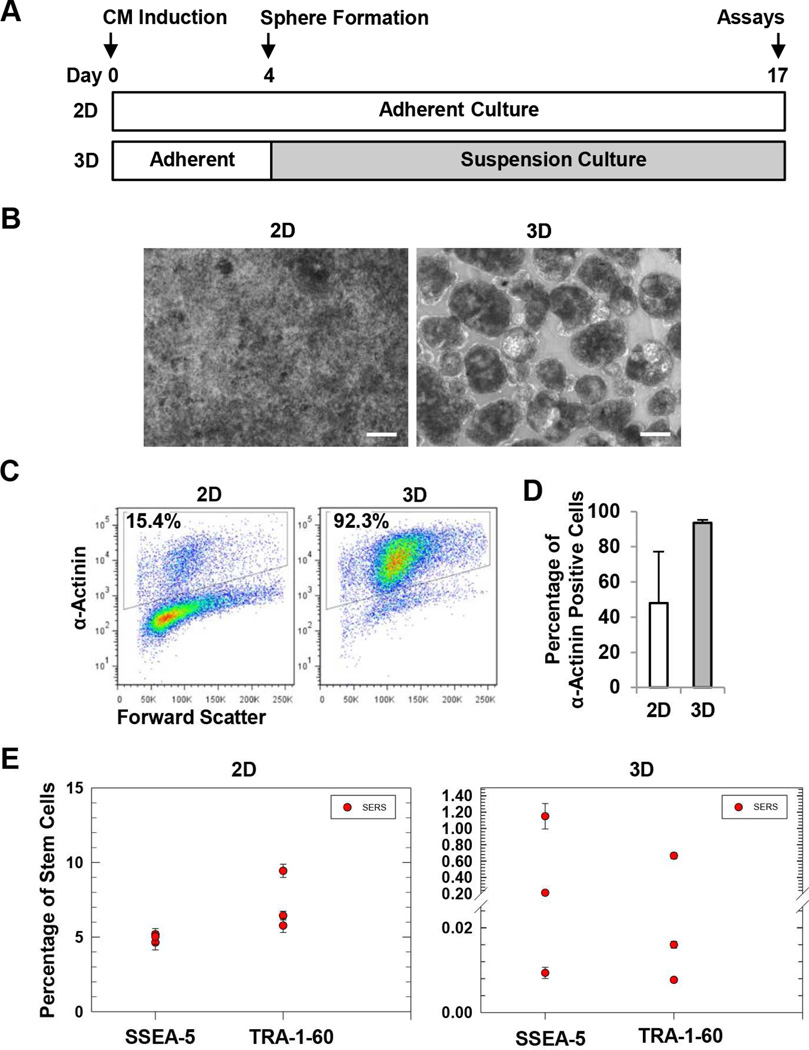
Figure 7.
Detection of residual SSEA-5+ and TRA-1-60+ cells in CM differentiation cultures. (A) Experimental design. Cardiomyocyte differentiation was induced by the treatment of activin A and BMP4. At differentiation day 4, cells were dissociated and forced to form 3D spheres using a microscale technology. After 24 h, the spheres were transferred and maintained in suspension culture. At differentiation day 17, both 3D cells and the parallel 2D cultures were harvested and analyzed for cardiomyocyte purity and levels of residual SSEA-5+ and TRA-1-60+ cells. (B) Cell morphology of 2D and 3D cultures. Scale bar = 100 µm. (C) Representative flow cytometry analysis of α-actinin, a cardiomyocyte-associated marker. (D) Summary of cardiomyocyte purity determined by flow cytometry analysis of α-actinin. (E) Levels of residual SSEA-5+ and TRA-1-60+ cells in 2D and 3D cardiomyocyte differentiation cultures. Test samples from differentiation cultures and standard samples (cell preparations containing various amounts of hPSCs mixed with NIH3T3 fibroblasts) were analyzed by the multiplexing SERS assay. Levels of residual SSEA-5+ and TRA-1-60+ cells in the test samples were determined according to standard curves.

