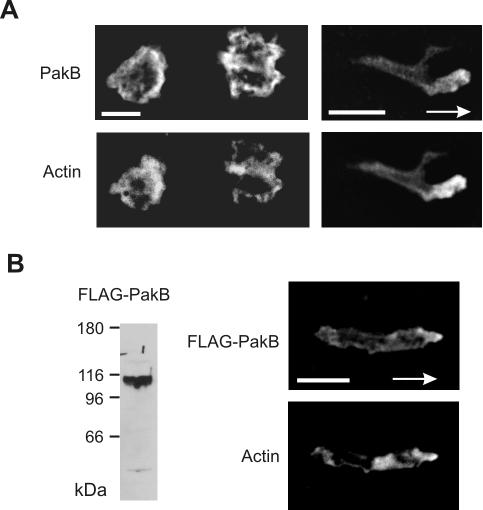
Figure 3.
PakB localizes to the leading edge of migrating cells. (A) Paired fluorescent images of resting growth-phase JH10 cells (left) and polarized aggregation phase JH10 cells (right) labeled with anti-PakB antibody (top) and TRITC-phalloidin (bottom). The arrow shows the direction of migration toward the aggregation center. (B) Immunoblot analysis (left) of whole cell lysates from PakB-null cell transformants expressing FLAG-PakB by using anti-FLAG M5 antibody. FLAG-PakB was expressed as a protein of ∼110 kDa. Paired fluorescent images of an aggregation stage amoeba stained with M5 anti-FLAG antibody (top) and TRITC-phalloidin (bottom right). Arrows show the direction of cell migration toward the aggregation center. Bars, 5 μm.

