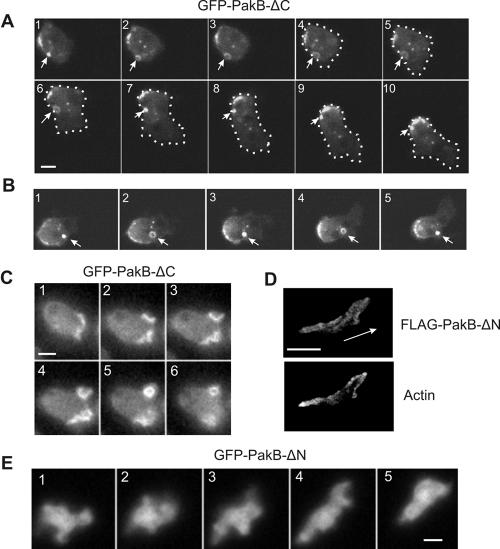
Figure 6.
PakB-ΔC accumulates at the posterior of migrating cells, whereas PakB-ΔN is diffusely distributed in the cell body. (A) Time lapse fluorescent images of a live 4-h starved amoeba from the GFP-PakB1 clonal cell line, containing GFP-PakB-ΔC. Images taken at intervals of 10 s show an amoeba that was initially stationary (1-3) and then migrated to the lower right (4-10). GFP-PakB-ΔC rapidly accumulated at the rear of the moving cell. The dot-like structures were frequently observed to expand into ring-shaped structures (arrows). The outline of the cell is indicated by the dotted white line. (B) Time-lapse fluorescent images taken at 10-s intervals show the opening and closing of a GFP-PakB-ΔC-containing structure (arrows). (C) Time-lapse fluorescent images taken at 10-s intervals of a live 2-h starved amoeba show that GFP-PakB-ΔC is associated with pinocytotic cups. (D) Paired fluorescent images of a PakB-null cell expressing FLAG-PakB-ΔN labeled with anti-FLAG antibody (top) and TRITC-phalloidin (bottom). The aggregation-phase cell was migrating in the direction indicated by the arrow. (E) Time-lapse fluorescent images taken at 10-s intervals of a live 6-h starved PakB-null cell expressing GFP-PakB-ΔN. Bar, 5 μm.

