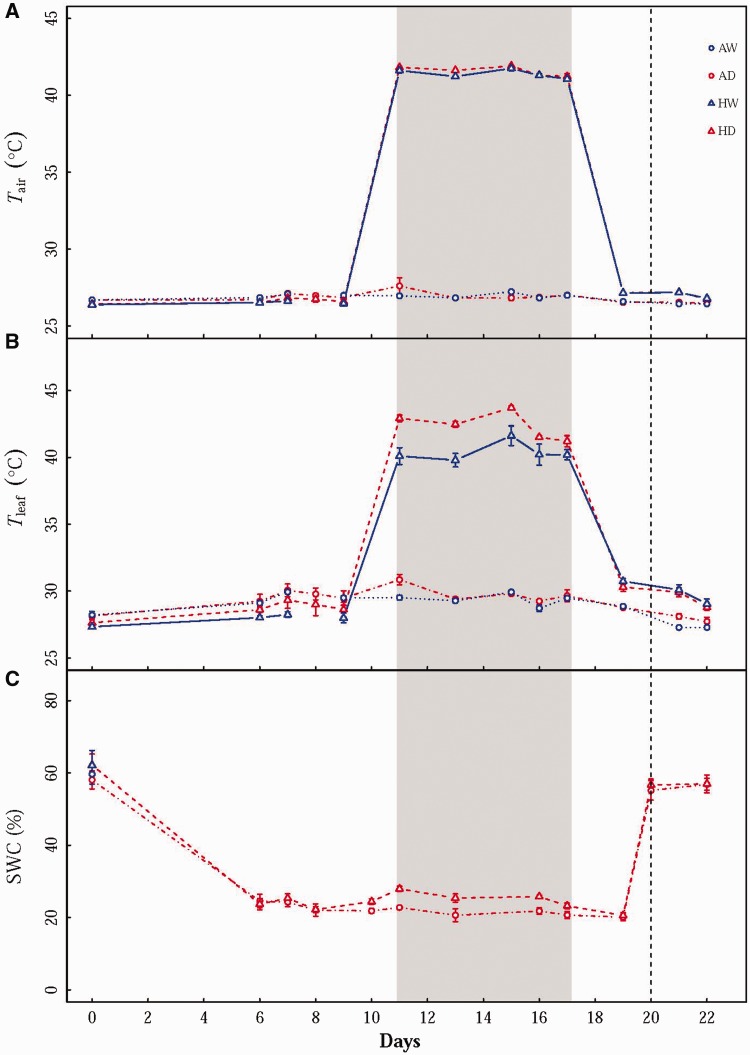
Figure 1.
Measured (A) daytime air temperature (Tair), (B) leaf temperature (Tleaf) and (C) soil water content (SWC) at 8 cm depth throughout the experiment. Values are means ± SE (n = 4–6). The grey area represents the period during which a 7-day 42 °C heat wave was applied. The vertical line represents the day when droughted seedlings were rehydrated. Treatments: AW–Ambient temperature plus well watered; AD–Ambient temperature plus drought; HW–Heat wave plus well watered; HD–Heat wave plus drought.

