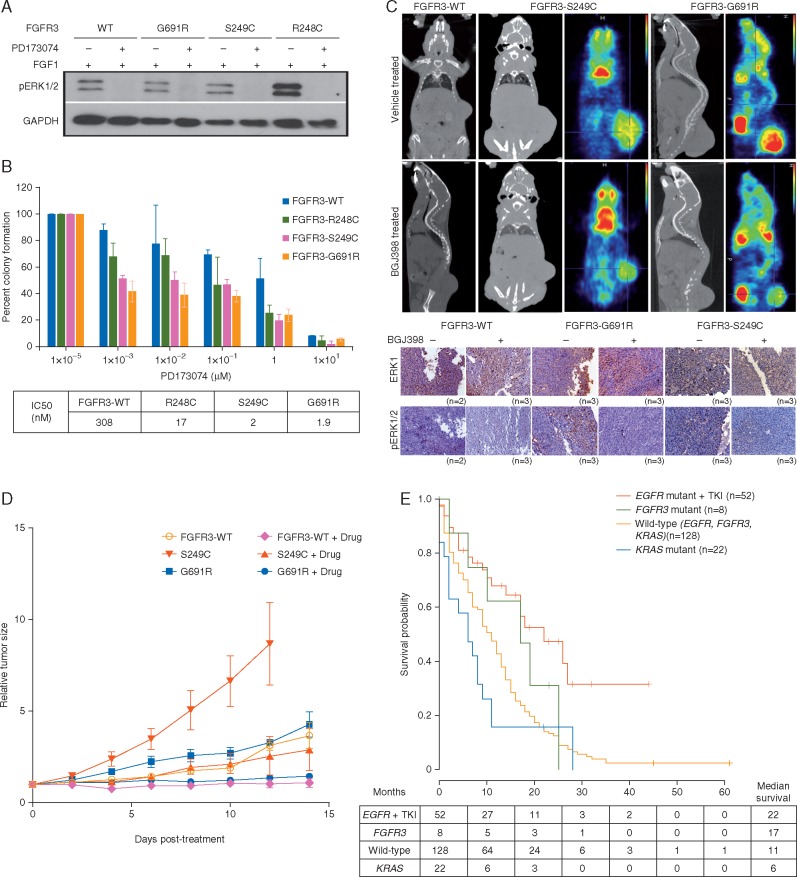
Figure 2.
Transformed NIH/3T3 cells and xenografts are sensitive to FGFR inhibitor. (A) Immunoblot analysis of NIH/3T3 clones treated with FGF1 (50 ng/ml) followed by FGFR inhibitor PD173074 (2 µM) is shown. GAPDH was used as loading control. (B) Soft agar colony count (averaged from 3 replicates) and IC-50 values of NIH/3T3 clones expressing wild-type or mutant FGFR3, treated with increasing concentration of PD173074 is shown. (C) Upper panel: NIH/3T3 xenografts developed into NOD-SCID mice were treated with FGFR inhibitor BGJ-398 or vehicle for 21 days. CT-scan and a readout for relative 18F-FDG uptake is shown by a gradient color code with red indicating as maximum uptake. Lower panel: Immuno-histochemical staining of total and phospho-ERK1/2 is shown in xenografts treated with drug and vehicles. (D) The plot shows tumor size (normalized to the size at day 0 of drug treatment) during the course of drug treatment indicating a reduced tumor size in drug-treated xenografts. (E) Clinical follow-up of total 205 patients for up to 62 months was used for the Kaplan–Meier analysis. EGFR positive patients received Gefitinib as a regular therapeutic regimen while rest of the patients received conventional chemotherapy. The table below the plot indicates patients at risk during the course of 60 months and median survival for each mutant group. Detailed figure legend can be found in supplementary materials, available at Annals of Oncology online.

