
Figure 2.
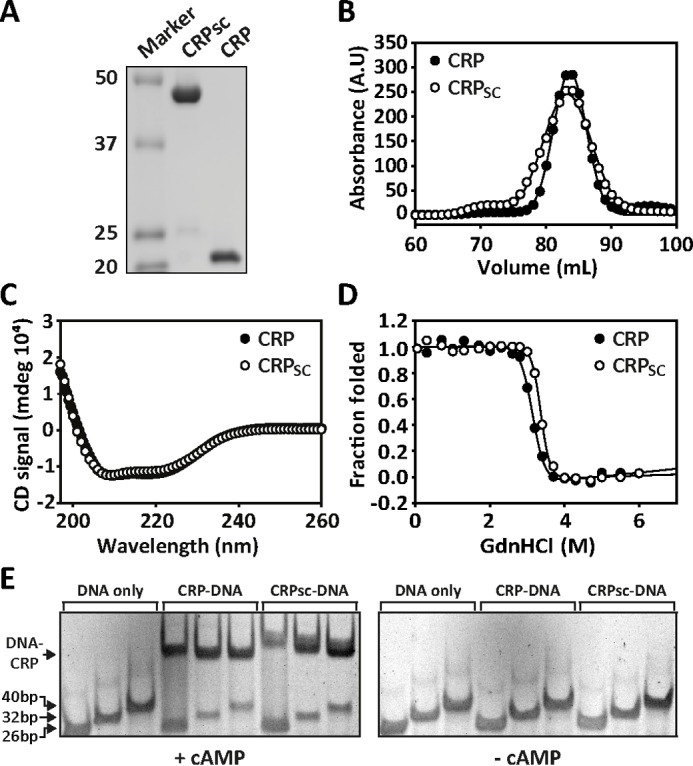
Biophysical and functional characterization of CRPSC. A, SDS-PAGE showing the molecular mass (in kDa) of CRPSC versus wild-type CRP (labeled CRP in all figure panels). B, size-exclusion chromatogram of CRPSC and wild-type CRP. C, CD spectra of CRPSC and wild-type CRP. D, chemical denaturation of CRPSC and wild-type CRP monitored by changes in tryptophan fluorescence. The line corresponds to the fit of a two-state unfolding model as described under “Materials and Methods.” E, CRP-DNA interactions monitored by electrophoretic mobility shift assay using increasing lengths of the lac promoter in the absence and presence of 200 μm cAMP for CRPSC and wild-type CRP.