Figure 6.
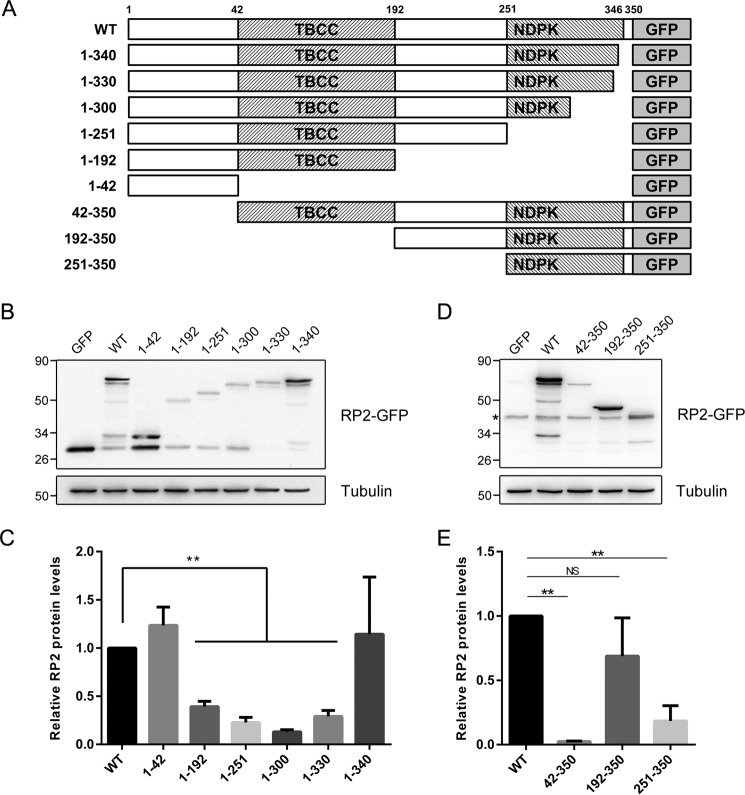
Expression levels of the C-terminal and N-terminal truncations of RP2. A, schematic diagram of the truncated RP2 proteins with a C-terminal GFP tag. The exact length of all studied truncations of RP2 is shown. B and D, the series of C-terminal truncated (B) and N-terminal truncated (D) RP2 were transfected into ARPE-19 cells, respectively. Their expression levels were determined by Western blot using either the anti-GFP antibody or the anti-RP2 antibody. Tubulin was used as a loading control. The experiment shown was replicated at least three times. C and E, the quantitative results of (B and D) are shown as the mean with S.D. (n = 3), correspondingly. **, p < 0.01; NS, non-significant.

