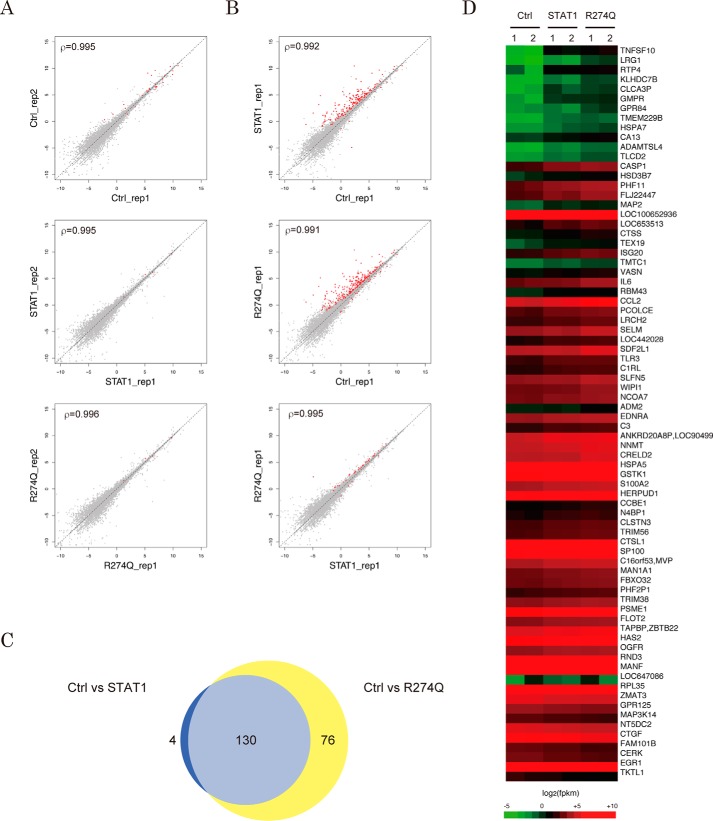
Figure 6.
Effect of the R274Q mutation on the IFN-γ-induced genome-wide gene expression profile. A and B, scatter plots depict different genome-wide expression profiles of experimental duplicates (A) or of the IFN-γ-stimulated U3C cells expressing the indicated STAT1 constructs (B). Each dot represents log-transformed FPKM values of RefSeq gene transcripts. The red dots indicate those transcripts with statistically significant differences between the x axis and the y axis libraries. The statistical relationship between the duplicates is indicated by Spearman's rank correlation coefficient ρ. The experiments were performed in duplicate. C, a Venn diagram demonstrates the number of RefSeq genes with statistically significant differences in comparison with the transcripts of the indicated libraries. The gene symbols are listed in supplemental Table S2. D, heat map presents expression profile of 76 of the R274Q-sensitive genes. Gene symbols are indicated (right).

