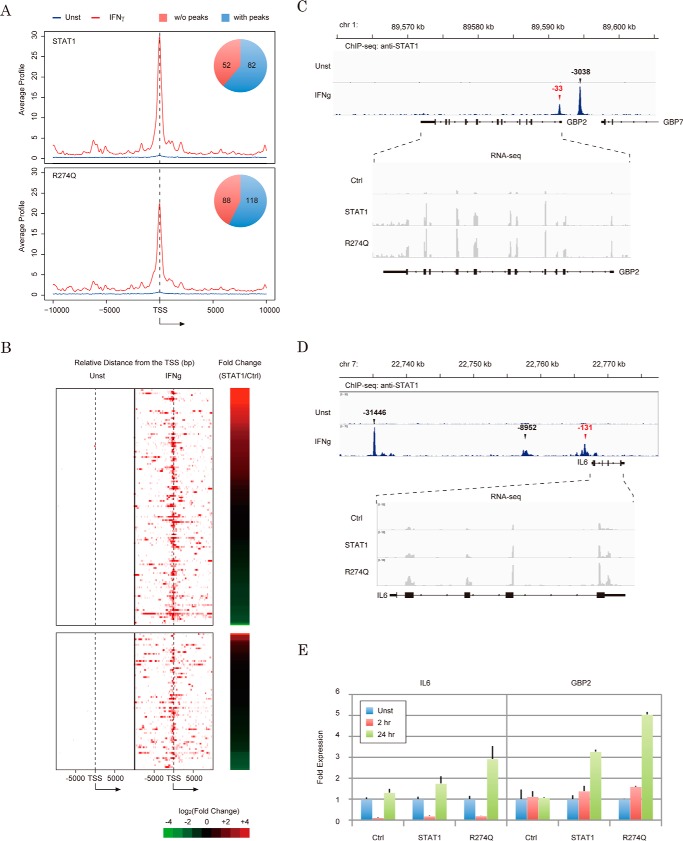
Figure 7.
Effect of the R274Q mutation on IFN-γ-dependent regulation of the STAT1 target gene. A, averaged ChIP signal of STAT1 was plotted for the promoters of the STAT1- or R274Q-regulated RefSeq genes detected in Fig. 6. A pie chart shows the number of RefSeq genes harboring STAT1 peaks within 1 kb of the transcription start site. TSS, transcription start site. B, heat map demonstrates the intensity of the STAT1 occupancy of the STAT1-regulated (top) or R274Q-specific (bottom) genes shown in Fig. 6C in the presence (middle) or the absence (left) of IFN-γ. -Fold changes of FPKM values of STAT1 relative to Ctrl are displayed on the right of the panel. C and D, enrichment of the reads of ChIP-seq for STAT1 (top) and RNA-seq of R274Q-dependent transcription (bottom) on the GBP2 gene (C) and IL6 gene (D). Genome position and exon-intron structure are indicated at the top and bottom, respectively. E, validations of IFN-γ-induced activation of IL6 (left) and GBP2 (right) by RT-qPCR. The Ct value in each condition is normalized against the expression levels of GAPDH. Error bars, S.D. of each condition.

